Download

1 / 16
160 likes | 256 Views
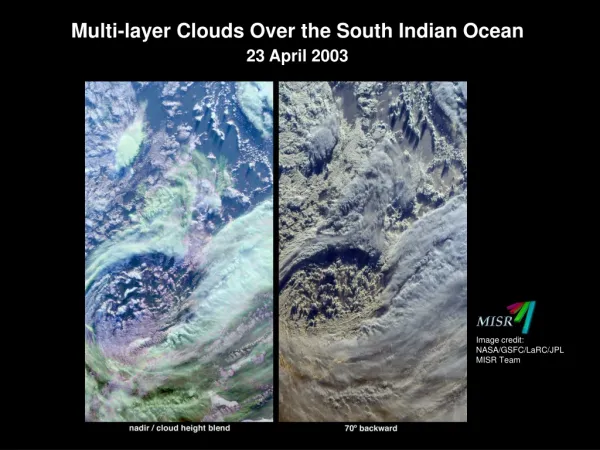
The MJO Cloud Population over the Indian Ocean. H. C. Barnes R. Houze S. Brodzik University of Washington. 30 th Conference on Hurricanes and Tropical Meteorology 19 April 2012, Ponte Vedra Beach, Florida . Objectives.

E N D
The MJO Cloud Population over the Indian Ocean H. C. Barnes R. Houze S. Brodzik University of Washington 30th Conference on Hurricanes and Tropical Meteorology 19April 2012, Ponte Vedra Beach, Florida
Objectives • Variability of precipitating clouds in MJO using TRMM Precipitation Radar • Associated humidity, winds, and wind shear
Phases of the MJO Phase 1 Phase 2 3 ACTIVE STAGE Phase 3 4 Phase 4 END OF ACTIVE STAGE 5 Phase 5 6 SUPPRESSED STAGE Phase 6 7 Phase 7 8 Phase 8 Wheeler and Hendon 2004
Tropical Cloud Population Isolated, Shallow MESOSCALE CONVECTIVE SYSTEMS (MCSs) • 2A23 classification of shallow, isolated radar echoes • storm top << freezing level • Not connected to non-shallow precipitation Houze et al. 1980
TRMM PR Identification of Extreme Precipitating Regions in MCSs Identify each contiguous 3D echo objectseen by TRMM PR Convective component Stratiform component Extreme characteristic Contiguous stratiform echowith horizontal area > 50 000 km2 “Broad stratiform region” Extreme characteristic Contiguous 3D volume ofconvective echo > 30 dBZ Top height > 8km “Deep convective core” Horizontal area >800 km2 “Wide convective core” Houze et al, 2007, Romatschke et al. 2010, Rasmussen and Houze 2011
Frequency of Isolated, Shallow Radar EchoesSmall Variability 10N EQ 10S 60E 90E %
Frequency of Deep Convective CoresSmall Variability 10N EQ 10S 60E 90E %
Frequency of Broad Stratiform RegionsLarge Variability With Phase 10N EQ 10S 60E 90E %
Summary of TRMM PR Study Isolated, shallow and deep convection is relatively constant Broad stratiform regions most common during active stage (phase 3) Mapes and Houze 1993, Chen et al. 1996, Yuterand Houze 1998, Morita et al. 2006
NCEP Reanalysis Study • 4x daily data when Wheeler and Hendon amplitude > 1 • October – February, 1998-2009 Region: 60E – 90E, 10S – 10N • Composite by phase • Relative humidity anomaly • Defined relative to the average of all phases • Wind field • Deep vertical wind shear (1000 – 300 hPa)
700 hPa Relative Humidity AnomaliesActive Stage Moist, Suppressed Stage Dry %
Conclusions Broad stratiform regions experience the greatest amount of variability
EndThis research was supported by NSF grant AGS-1059611 and DOE grant DE-SC0001164/er-64752