Download

1 / 42
420 likes | 476 Views
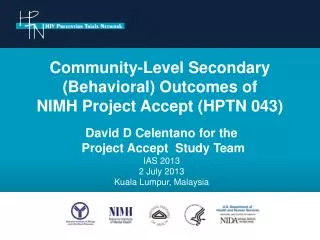
ADVANCE. Main Results. Secondary Outcomes. All-cause mortality. 25. Standard Intensive. 20. Relative risk reduction 7%: 95% CI -6 to 17% P =0.28. 15. Cumulative incidence (%). 10. 5. 0. 0. 6. 18. 24. 30. 36. 12. 42. 48. 54. 60. 66. Follow-up (months). Death.

E N D
ADVANCE Main Results Secondary Outcomes
All-cause mortality 25 Standard Intensive 20 Relative risk reduction 7%: 95% CI -6 to 17% P=0.28 15 Cumulative incidence (%) 10 5 0 0 6 18 24 30 36 12 42 48 54 60 66 Follow-up (months)
Death Number of patients with event Intensive Standard Favors Favors Relative risk (n=5,571) (n=5,569) Intensive Standard reduction (95%CI) All deaths 498 533 7% (-6 to 17) Cardiovascular death 253 289 12% (-4 to 26) Non-cardiovascular death 245 244 0% (-20 to 16) 0.5 1.0 2.0 Hazard ratio
Coronary and cerebrovascular events Number of patients with event Intensive Standard Favors Favors Relative risk (n=5,571) (n=5,569) Intensive Standard reduction (95% CI) Total coronary events 560 572 2% (-10 to 13) Major coronary events† 310 337 8% (-7 to 21) Total cerebrovascular events 352 327 -8% (-26 to 7) 238 Major cerebrovascular events‡ 246 3% (-16 to 19) 0.5 1.0 2.0 Hazard ratio †Non-fatal MI or death from coronary heart disease ‡Non-fatal stroke or death from cerebrovascular disease
Renal events Number of patients with event Intensive Standard Favors Favors Relative risk (n=5,571) (n=5,569) Intensive Standard reduction (95% CI) † Total renal events 1498 1669 11% (5 to 17) New microalbuminuria 1318 1434 9% (2 to 15) ‡ *** New or worsening nephropathy 230 292 21% (7 to 34) 0.5 1.0 2.0 Hazard ratio †P<0.001 ‡P=0.02 ***P=0.006
Nephropathy Number of patients with event Intensive Standard Favors Favors Relative risk (n=5,571) (n=5,569) Intensive Standard reduction (95% CI) New or worsening nephropathy 230 292 21% (7 to 34)† Macroalbuminuria 162 231 30% (15 to 43)‡ Doubling of serum creatinine* 69 60 -15% (-63 to 18) End-stage renal disease 23 36 36% (-8 to 62) 0.5 1.0 2.0 Hazard ratio †P=0.006 ‡P<0.001 *to at least 200 μmol/L (2.3 mg/dL)
Eye events Number of patients with event Intensive Standard Favors Favors Relative risk (n=5,571) (n=5,569) Intensive Standard reduction (95% CI) Total eye events 3105 3094 0% (-5 to 5) New or worsening retinopathy 332 349 5% (-10 to 18) Visual deterioration 3033 3015 0% (-5 to 5) 0.5 1.0 2.0 Hazard ratio
Heart failure, PVD and neuropathy Number (%) of patients with event Intensive Standard Favors Favors Relative risk (n=5,571) (n=5,569) Intensive Standard reduction (95% CI) All heart failure 220 231 5% (-14 to 21) All peripheral vascular disease 343 366 6% (-9 to 19) New or worsening neuropathy 2353 2311 -4% (-10 to 2) 0.5 1.0 2.0 Hazard ratio
Cognitive function and dementia Number of patients with event Intensive Standard Favors Favors Relative risk (n=5,571) (n=5,569) Intensive Standard reduction (95% CI) Dementia 61 48 -27% (-86 to 13) Cognitive decline 895 911 2% (-7 to 11) 0.5 1.0 2.0 Hazard ratio
ADVANCE Effects in Patient Subgroups
Effects by age, sex, SBP & glucose controlCombined primary end point Number of patients with event Intensive Standard Favors Favors Relative risk (n=5,571) (n=5,569) Intensive Standard reduction (95% CI) Age (years) < 65 367 421 14% (1 to 25) 65 642 695 8% (-3 to 17) Sex Male 635 705 10% (0 to 19) Female 374 411 10% (-3 to 22) SBP (mmHg) < 140 368 404 9% (-4 to 21) 140 641 712 11% (1 to 20) HbA1c (%) < 7.2 387 430 10% (-3 to 22) 7.2 620 682 10% (0 to 20) Fasting blood glucose (mmol/L) < 7.9 (142 mg/dL) 414 472 13% (0 to 23) 7.9 (142 mg/dL) 595 643 8% (-2 to 18) All participants 1009 1116 10% (2 to 18) 0.5 1.0 2.0 Phomogeneity all >0.1 Hazard ratio
Effects by disease history & ancillary treatmentCombined primary end point Number of patients with event Intensive Standard Favors Favors Relative risk (n=5,571) (n=5,569) Intensive Standard reduction (95% CI) History of macrovascular disease No 591 678 14% (4 to 23) Yes 418 438 4% (-10 to 16) History of microvascular disease No 799 892 11% (2 to 19) Yes 210 224 4% (-16 to 21) Treatment with any BP lowering drugs No 199 222 11% (-7 to 27) Yes 810 894 10% (1 to 18) Treatment with ACE inhibitors No 495 537 14% (3 to 24) Yes 514 579 5% (-7 to 16) Treatment with statins No 746 815 10% (1 to 19) Yes 263 301 10% (-6 to 24) Treatment with anti-platelet drugs No 485 541 9% (-2 to 20) Yes 524 575 11% (0 to 21) All participants 1009 1116 10% (2 to 18) 0.5 1.0 2.0 Hazard ratio Phomogeneity all >0.1
Effects by age, sex, SBP and glucose controlCardiovascular death Number of patients with event Intensive Standard Favors Favors Relative risk (n=5,571) (n=5,569) Intensive Standard reduction (95% CI) Age (years) < 65 63 64 2% (-39 to 31) 65 190 225 15% (-3 to 30) Sex Male 172 197 12% (-8 to 28) Female 81 92 12% (-18 to 35) SBP (mmHg) < 140 82 112 27% (3 to 45) 140 171 177 3% (-19 to 22) HbA1c (%) < 7.2 90 110 18% (-8 to 38) 7.2 161 178 10% (-12 to 27) Fasting blood glucose (mmol/L) < 7.9 (142 mg/dL) 110 137 20% (-3 to 38) 7.9 (142 mg/dL) 143 152 6% (-18 to 25) All participants 253 289 12% (-4 to 26) 0.5 1.0 2.0 Hazard ratio Phomogeneity all >0.1
Effects by age, sex, SBP and glucose controlAllcausemortality Number (%) of patients with event Intensive Standard Favors Relative risk Favors (n=5,571) (n=5,569) Standard reduction (95% CI) Intensive Age (years) < 65 111 119 7% (-20 to 28) 65 387 414 6% (-8 to 18) Sex Male 350 360 2% (-13 to 16) Female 148 173 15% (-6 to 32) SBP (mmHg) < 140 168 203 17% (-1 to 33) 140 330 330 -0% (-17 to 14) HbA1c (%) < 7.2 206 214 3% (-17 to 20) 7.2 289 317 9% (-7 to 22) Fasting blood glucose (mmol/L) < 7.9 (142 mg/dL) 225 263 15% (-2 to 28) 7.9 (142 mg/dL) 272 270 0% (-19 to 15) All participants 498 533 7% (-6 to 17) 0.5 1.0 2.0 Hazard ratio Phomogeneity all >0.1
No evidence of different effects in patient subgroups for the combined primary outcome, cardiovascular death or total mortality Subgroup effects
ADVANCE Main Results Other risk factors and concomitant treatments
Intensive glucose control resulted in: 10% reduction in combined primary outcome 14% reduction in microvascular events 21% reduction in nephropathy No significant effects on macrovascular events No significant effects on all-cause or cardiovascular mortality Consistent treatment effects in patient subgroups Summary – effects on main efficacy outcomes
ADVANCE Hypoglycemia
A blood glucose level <2.8 mmol/L (50mg/dL) and/or an episode with typical symptoms and signs of hypoglycemia, without other apparent cause SEVERE where an individual had transient central nervous system dysfunction and was unable to treat him/herself (required help from another person) MINOR where the individual was able to treat him/herself Definition
Effects of treatment on hypoglycemiaHazard ratios Number of patients with event Intensive Standard Standard Intensive Relative (n=5,571) (n=5,569) worse worse increase (95% CI) Any hypoglycemia 2654 1870 42% (36 to 49) Minor hypoglycemia 2598 1834 42% (35 to 48) Severe hypoglycemia 150 81 85% (42 to 142) 0.5 1.0 2.0 Risk ratio All P<0.001
Rates of hypoglycemiaMinor and severe 140 +40%* Intensive control 120 Standard control 100 80 Events per 100 patient years 60 +87%* 40 20 0.7 0.4 0 Minor hypoglycemia Severe hypoglycemia *P<0.001
Comparative rates of severe hypoglycemia 2.0% 1.6% Intensive control Standard control 1.2% Proportion of patients with at least one event each year 0.8% 0.4% 0.0% UKPDS ADVANCE
One fatal episode in the standard control group One episode leading to permanent disability in each of the standard and intensive groups Fatal or disabling sequelae of severe hypoglycemia
Effects of severe hypoglycemia on cognitive function (MMSE) Change in MMSE during follow-up 0.67 (0.27-1.06) Change in MMSE during follow-up 0.11 (0.06-0.15) 30 Baseline to follow-up difference 0.56 (0.26-0.87) 20 Mean MMSE score 10 At baseline At final visit 0 None One or more Number of severe hypoglycemic events
Intensive glucose control increased the risk of severe hypoglycemia Rates of severe hypoglycemia were low No significant long-term sequelae were identified More than half of patients reported neither minor or severe hypoglycemia Summary - hypoglycemia
ADVANCE Body Weight
Difference in body weight 80 Difference 0.75kg (0.56, 0.94) 1.65lbs (1.23, 2.07), P<0.0001 79 78 Weight (kg) 77 76 Standard Intensive 75 0 6 12 18 24 30 36 42 48 54 60 Follow-up (months)
Asian Mean baseline weight = 67kg (145lbs) Mean weight difference = 0.44kg (0.97lbs) 0.7% of baseline weight Non-Asian Mean baseline weight = 85kg (187lbs) Mean weight difference = 0.96kg (2.1lbs) 1.1% of baseline weight Impact of ethnicity
UKPDS Weight gain about 3.1kg (6.8lbs) Mostly in first few years after diagnosis Follow-up 10 years ADVANCE No weight gain Weight difference 0.75kg (1.65lbs) Follow-up 5 years Weight difference projected to 10 years = 1.8kg (4.0lbs) Impact of follow-up duration
No weight gain in ADVANCE Weight difference between randomized groups less in ADVANCE than UKPDS Difference likely explained in part at least by ethnicity, stage of disease and duration of follow-up Summary - weight
Five years treatment Prevents one vascular event among every 52 patients (mostly renal events) Causes one severe hypoglycemic event among every 81 patients Balance of risk and benefits
ADVANCE ADVANCE in the context of other studies
Baseline characteristics * Calculated HbA1c
ACCORD UKPDS
Event rates – all cause mortality 2.0 1.5 Annual incidence (%) 1.0 0.5 0.0 UKPDS ADVANCE ACCORD
0.94 ( 0.80 , 1.10 ) 0.93 0.93 ( ( 0.85 0.83 , , 1.02 1.06 ) ) 1.22 ( 1.01 , 1.46 ) Mortality (meta-analysis) Hazard ratio (95% CI) UKPDS ADVANCE Combined ACCORD 0.5 1 2 Risk ratio (95% CI) Favors standard glucose control Favors intensive glucose control P heterogeneity = 0.016