Download
1 / 18
180 likes | 302 Views
FiberViewer Light Tutorial. Berger Jean-Baptiste jean-baptiste.berger@cpe.fr. Launch from Slicer. For Linux and Mac users: Open the modules list Diffusion Tractography FiberViewer Light. For Windows users: Go into your Slicer directory (Slicer 4.0.1) then open

E N D
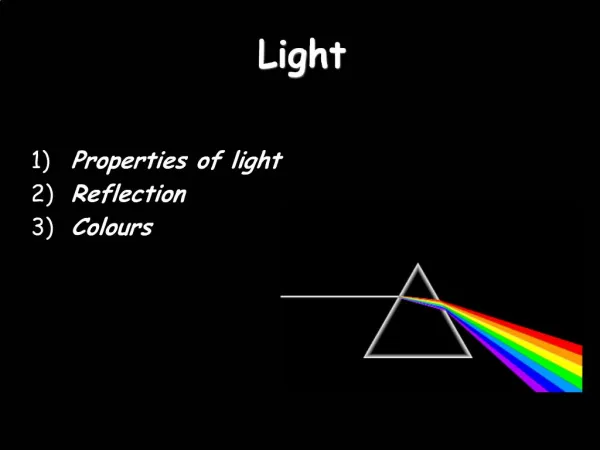
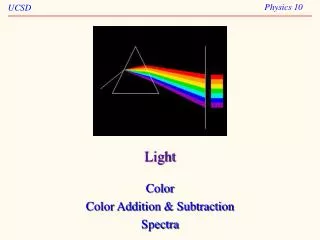
FiberViewer LightTutorial Berger Jean-Baptiste jean-baptiste.berger@cpe.fr
Launch from Slicer For Linux and Mac users: Open the modules list Diffusion Tractography FiberViewer Light For Windows users: Go into your Slicer directory (Slicer 4.0.1) then open lib Slicer-4.0 cli-modules Double click on FiberViewerLight.exe
Launch from Slicer For Linux and Mac users: Select your FiberBundle You can select a FiberBundle to save on or create a new one
Getting Started • From GUI : • Select a VTK Input File • Choose the Clustering Method • From Command Line : • ./FiberViewerLight -i input_name -o output_name
Length Method • Fiber extremities is Threshold default values • Bars option is the number of bars that will be used on the histogram if none of the fibers were thresholded • Click on Apply Threshold to display the thresholded fiber • Click Next or Undo to go back to the main screen, Next will keep changes
Length Method • Colors go from blue (shortest) to red (longest)
Gravity, Hausdorff and Mean Methods • Same general approach for each method • Algorithm based on gravity, Hausdorff or mean pairwise distance matrix : • Distance between each center of gravity • Maximum of pair wise distances of two fibers • Mean of pair wise distances between two fibers
Gravity, Hausdorff and Mean Methods • Clicking on “Compute Distribution” will generate histogram • There will be (Max – Min)/Step bars from Min to Max • Click on Next to display generated classes with Threshold value parameter
Cluster Selector • Structure of the table : Number of elements of Idthclass and associated color • Click on the number of elements to select class • Click again to deselect a class
Cluster Selector • Click on “Show” to display selected clusters only • “Undo” to go back to the Distribution panel • “Next” to keep changes and go back to main menu
Normalized Cut • Choose the number of cluster which will be the number of classes • Pairwise mean distance based algorithm
Saving your VTK File • When you are done : • Enter a VTK Filename on the main menu • Or • Click on “Save VTK” on the main menu and it will open a browser. • If there is a VTK Filename specified on the main menu, each time you will click on “Save VTK”, it will update the VTK output file
Plane Settings • Display a plane by clicking on Plane Option button • Default display : Center of gravity • Change origin and normal settings and update thanks to the corresponding button • Retrieve coordinates by clicking “Get Plan Param” button
Plane Settings • Translate the plan by dragging it • Rotate the plan by dragging the normal arrow
General Visualization Controls • Drag to rotate the view • Shift + Drag to translate the fiber • Ctrl + Drag to rotate on the perpendicular axe to the screen • Right dragging or wheel to zoom in or out
Contributors • Jean-Baptiste Berger : jean-baptiste.berger@cpe.fr • Clement Vachet : cvachet@unc.edu • Martin Styner : martin_styner@ieee.org