Download
1 / 24
240 likes | 367 Views
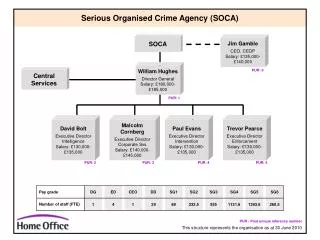
The Impact of Organised Crime on Business. Nick Tilley Jill Dando Institute of Crime Science UCL. Background to the research/ key aims. Research commissioned by the Home Office Rationale concern about OC harms in local neighbourhoods Main aims

E N D
The Impact of Organised Crime on Business Nick Tilley Jill Dando Institute of Crime Science UCL
Background to the research/ key aims Research commissioned by the Home Office Rationale concern about OC harms in local neighbourhoods Main aims To develop a method of measuring the impact of OC on local businesses in high crime communities To pilot survey methods with a study of up to 400 businesses, building on the Commercial Victimisation Survey questionnaire Key challenges To formulate and operationalise a definition of OC To identify ‘potential’ impacts of OC on business To devise valid and reliable measurement instruments To find a way of approaching businesses to talk about OC
Method Fieldwork in three contrasting sample neighbourhoods, where police believed organised crime to be significant All businesses identified through visual audit Survey of businesses within the sample areas ‘Teach’ respondents working definition of OC: ‘Any deliberate, co-operative criminal activity engaged in over a sustained period by the same set of three or more collaborating individuals.’ Ask respondents about wide range of types of crime, establishing if they thought any were ‘organised’ Ask respondents about repeat patterns of incident and event similarities Elicit ‘community knowledge’ of organised crime patterns, through semi structured interviews with key local business leaders Canvass police intelligence on organised crime, gangs and business victimisation
Data source 1: The survey Representative sample of businesses (though not areas) Indicators suggest high levels of reliability Key queries over validity Do the business respondents remember the number and attributes of incidents accurately? In practice, do respondents use the researcher-specified definition of organised crime? Do respondents know whether the incidents they have experienced result from ‘organised’ crime? Are respondents willing to talk candidly about their own organised crime victimisation? Will respondents talk candidly about offers of illicit goods and their own participation in organised crime?
Data source 2: Police intelligence Informed by access to range of police sources of information: reported crime, community consultation, informants, offenders, detected offences. No indicators of reliability No direct access to intelligence files Key queries over validity How typical are the cases the police remember or focus on? Do the police know about organised crime as understood for the research purposes? Do the police over-generalise from the extreme and dramatic? Are the police sometimes deliberately misinformed? Are police intelligence inferences from information warranted? Do the police tell researchers what they really know?
Data source 3: Community intelligence Informed by informal liaisons with community members, not compromised by mistrust of police or reluctance to be candid with researchers No time or resource for detailed ethnography, capturing what is ‘known’ Sources picked up opportunistically No indicators of reliability Key queries over validity Do the sources used by community informants have an accurate picture of organised crime, as understood in the research? Would well-informed community members tell researchers the truth as they see it? How likely is it that well-informed community members generalise from rather particular and dramatic events?
Main findings • Businesses in high crime neighbourhoods experience extraordinarily high rates of crime • Much of this crime involves repeat victimisation • There is little evidence that these businesses are suffering substantial, serious organised crime • Businesses in high crime neighbourhoods are frequently invited to participate in organised crime • Different high crime neighbourhoods furnish different ‘chemistries’ for organised crime
OC survey and CVS crime prevalence per 100 retail premises with nine or fewer staff Base: OC=175; CVS=2,738
Risk increases with numbers of incidents Base: All 420 businesses
Victim beliefs about whether or not incidents experienced resulted from organised crime Base: All 420 businesses
Main grounds survey respondents gave for believing crime to be organised Just a hunch The MO used Series of events Known/observed offenders
Variations in business vulnerability to organised crime By size By sector By area
Number of workers and per cent prevalence of organised crime
Area percentages of businesses experiencing any organised incident Base: All 420 businesses
Invitations to participate • Receive smuggled alcohol • Each business received on average 0.6 offers • Each business receiving at least one offer received on average 12 of them • Receive stolen goods • Each business received on average 12 offers • Each business receiving at least one offer received on average 36 of them • Receive smuggled tobacco • Each business received on average 12 offers • Each business receiving at least one offer received on average 74 of them • Receive counterfeit goods • Each business received on average 37 offers • Each business receiving at least one offer received on average 85 of them
Neighbourhood organised crime and data sources • The survey turned up less organised crime against businesses than expected • The police, and some members of e community, believed the areas to be ones where organised crime was thriving • The businesses might not have recognised the organised crime affecting them • The businesses may not have been candid about the organised crime they knew they were suffering • The impressions of organised crime may have been derived from prominent but quite rare events • The organised crime in the areas may not have local businesses as its main target
Variations in organised ‘crime chemistries’ in the three areas What locally brought suitable organised crime victims and likely offenders together in the absence of protection of the former from the latter through ‘capable guardianship’. What local ‘props’ were available to help commit or prevent organised crime: for example camouflage enabling the offender to escape notice What local ‘audiences’ were present to persuade or dissuade organised criminal behaviour by the likely offender?
The organised crime ‘chemistries’ appeared to vary by area • East Midlands • White working class • Established crime families • Intimidation and collaboration with businesses • West Midlands • Transitional area with changing ethnic composition • Loosely-knit ‘gangs’ committing crimes for status • High turnover of businesses, some used for crime some driven out by it • London • Middle-Eastern population, businesses and community organisations, with links back to countries of origin • Community organisations fronts for organised crime • Some pressure on businesses to collude and contribute
Conclusions The methods we used were the best in practice that we were able to come up with The findings from the three data sources do not in all cases sit easily with one another The survey findings appear to be reliable, though their validity is uncertain The survey findings are, we think, plausible and provide an alternative to professional and community impressions The professional/community views provide, however, a plausible but hard-to-test theory explaining different ways in which organised crime is produced and sustained in some high crime neighbourhoods. Some perceived benefits as well as harms to the local community were associated with organised crime