Download
1 / 8
90 likes | 275 Views
Companion PowerPoint slide set DNA Methylation & Cadmium Exposure in utero An Epigenetic Analysis Activity for Students.

E N D
Companion PowerPoint slide set DNA Methylation & Cadmium Exposure in uteroAn Epigenetic Analysis Activity for Students This teacher slide set was created by Dana Haine, MS, of the UNC Superfund Research Program, which is funded by the National Institute of Environmental Health Sciences (P42ES005948).
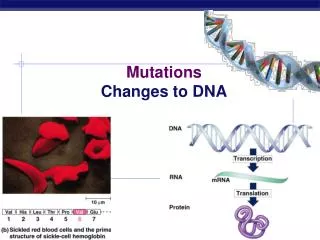
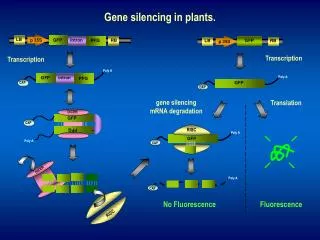
1) Changes to DNA Methylation leads to gene silencing Target gene expressed in normal cell e.g., tumor suppresor gene Normal State TF Promoter Target gene expressed Target gene inactivated by hypermethylation Disease State arising from Epigenetic Modification TF X Target gene not expressed Promoter
2) Changes to DNA Methylation leads to gene activation Target gene silenced by methylation e.g., oncogene TF Normal State X Promoter Target gene not expressed Target gene activated by hypomethylation or demethylation Disease State arising from Epigenetic Modification TF Target gene expressed Promoter
Cadmium Level: Hypermethylation Average Hypomethylation Higher Lower Cadmium Exposure Group: (Fry, 2011)
Blood Cadmium Level: <0.08 µg/L 1.11 µg/L Hypermethylation Rows 6-27 Average Hypomethylation Rows 1-5 Higher Lower Cadmium Exposure Group: (Fry, 2011. Unpublished)
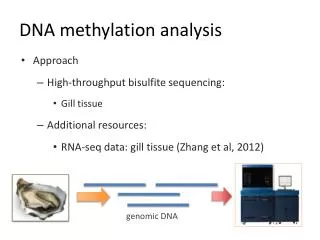
DNA from newborn cord blood was isolated then amplified using methylated CpG island recovery assay (MIRA). http://www.activemotif.com/catalog/43/methylcollector-methylcollector-ultra.html
Microarray analysis was used to determine which genes exhibited differential methylation in response to Cadmium exposure MIRA • Affymetrix Human Promoter 1.0R arrays which represent ~59 percent of known CpG islands (4.6 million sites; 14,362 CpG islands) Heat map analysis Adapted from http://www.bcm.edu/garp/?pmid=4660