Download
1 / 38
400 likes | 594 Views
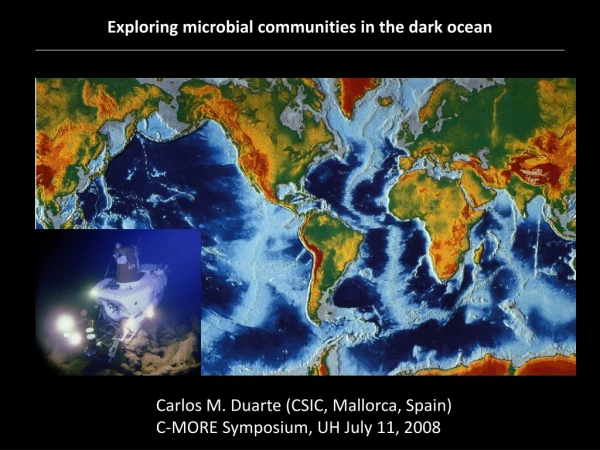
Charting the function of microbes and microbial communities. Curtis Huttenhower 11- 17- 11. Harvard School of Public Health Department of Biostatistics. Valm et al, PNAS 2011. What to do with your metagenome?. Reservoir of gene and protein functional information.

E N D
Charting the function of microbesand microbial communities Curtis Huttenhower 11-17-11 Harvard School of Public Health Department of Biostatistics
What to do with your metagenome? Reservoir of gene and protein functional information Comprehensive snapshot of microbial ecology and evolution Who’s there? What are they doing? Who’s there varies: your microbiota is plastic and personalized. This personalization is true at the level of phyla, genera, species, strains, and sequence variants. What they’re doing is adapting totheir environment:you, your body, and your environment. Public health tool monitoring population health and interactions Diagnostic or prognostic biomarker for host disease
Slides by Dirk Gevers The NIH Human Microbiome Project (HMP): A comprehensive microbial survey • What is a “normal” human microbiome? • 300 healthy human subjects • Multiple body sites • 15 male, 18 female • Multiple visits • Clinical metadata www.hmpdacc.org
A three-tier study design… 16S WGS ref
~36% ~57% ~50% …for mining metagenomic data 16S WGS >3k readsper sample ~100M readsper sample Filtering/ trimming Assembly Map on BLASTagainst functionalDBs Chimera removal contigs ref Annotation Taxonomicclassification (RDP) Clusteringinto OTUs genes census... ~90M proteins pathways Organismal censusat different taxonomic levels
“Pathogen” carriage varies a lot 22 ***uniquely identifiable*** nonzero abundance “pathogens” from NIAID’s list of 135 Gemella Capnocytophaga Gardnerella Actinomyces Alistipes >0.66 +Propionibacterium
Phenotypes that explain variation(or not) can be surprising Normalized relative abundance
Phenotypes that explain variation(or not) can be surprising Normalized relative abundance
Phenotypes that explain variation(or not) can be surprising Normalized relative abundance
A functional perspective on thehuman microbiome 100 subjects 1-3 visits/subject ~7 body sites/visit 10-200M reads/sample 100bp reads Healthy/IBD BMI Diet Metagenomic reads BLAST Functional seq. KEGG + MetaCYC CAZy, TCDB,VFDB, MEROPS… ? Geneexpression SNPgenotypes Taxon abundances Enzyme family abundances Pathway abundances Enzymes and pathways HUMAnN HMP Unified MetabolicAnalysis Network http://huttenhower.sph.harvard.edu/humann
HUMAnN: Metabolic reconstruction Vaginal Oral (BM) Gut Oral (SupP) Oral (TD) Skin Nares ← Pathways→ ← Samples → Vaginal Skin Nares Oral (SupP) Oral (BM) Oral (TD) Gut ← Pathways→ ← Samples → Pathway coverage Pathway abundance
A portrait of the healthy human microbiome:Who’s there vs. what they’re doing ← Subjects → ← Phylotype abundance → ← Phylotype abundance → Oral (BM) Oral (SupP) Oral (TD) Nares Vaginal Skin Gut ← Pathway abundance → ← Pathway abundance → ← Subjects →
Niche specialization in human microbiome function Metabolic modules in theKEGG functional catalogenriched at one or morebody habitats ← Pathway abundance→ ← ~700 HMP communities→ • 16 (of 251) modules strongly “core” at 90%+ coverage in 90%+ individuals at 7 body sites • 24 modules at 33%+ coverage • 71 modules (28%) weakly “core” at 33%+ coverage in 66%+ individuals at 6+ body sites • Contrast zerophylotypes or OTUs meeting this threshold! • Only 24 modules (<10%) differentially covered by body site • Compare with 168 modules (>66%) differentially abundant by body site
Proteoglycan degradationby the gut microbiota Glycosaminoglycans(Polysaccharide chains) AA core
Proteoglycan degradation:From pathways to enzymes Enzyme relative abundance 10-8 10-3 • Heparan sulfate degradation missing due to the absence ofheparanase, a eukaryotic enzyme • Other pathways not bottlenecked by individual genes • HUMAnN links microbiome-wide pathway reconstructions → site-specific pathways → individual gene families
Patterns of variation in human microbiome function by niche • Three main axes of variation • Eukaryotic exterior • Low-diversity vaginal • Gut metabolism • Oral vs. tooth hard surface • Only broad patterns: every human-associated habitat is functionally distinct!
Normal varies a lot at the genus level (16S) Relative frequency of genera within Stool 343 genera Parabacteroides Faecalibacterium Alistipes Relative frequency Bacteroides 200 subjects Dirk Gevers
Normal varies a lot at the species level (WGS) Relative frequency of Bacteroides species within Stool Relative frequency Bacteroides caccae Bacteroides stercoris Bacteroides sp. Bacteroides uniformis Bacteroides sp. Bacteroides vulgatus 123 samples Dirk Gevers
What’s wrong with this picture? Species and strains matter – but so does your method for identifying them in a community! 52 posterior fornix microbiomes → Lactobacillus crispatus MV-1A-US Lactobacillus crispatus JV-V01 Lactobacillus crispatus 125-2-CHN Lactobacillus crispatus 214-1 Lactobacillus crispatus MV-3A-US Lactobacillus crispatus ST1 Lactobacillus gasseri JV-V03 Lactobacillus gasseri 202-4 Lactobacillus gasseri 224-1 Lactobacillus gasseri MV-22 Bifidobacteriumbreve DSM 20213 Bifidobacteriumdentium ATCC 27679 Mycoplasma hominis Clostridialesgenomosp BVAB3 str UPII9-5 Clostridialesgenomosp BVAB3 UPII9-5 Gardnerellavaginalis AMD Prevotellatimonensis CRIS 5C-B1 Megasphaeragenomosp type 1 str 28L Porphyromonasuenonis 60-3 Gardnerellavaginalis 409-05 Gardnerellavaginalis 5-1 Atopobiumvaginae DSM 15829 Gardnerellavaginalis ATCC 14019 Lactobacillus jensenii 1153 Lactobacillus jensenii 269-3 Lactobacillus jensenii SJ-7A-US Lactobacillus jensenii 208-1 Lactobacillus jensenii JV-V16 Lactobacillus jensenii 27-2-CHN Lactobacillus jensenii 115-3-CHN Lactobacillus iners AB-1 Lactobacillus iners DSM 13335
Core gene families • A core gene is a gene strongly conserved within a clade Gene X • Gene X is a core gene for Clade Y • All subclades of Clade Y must have Gene X as core gene (strict definition) • Gene X may be a core gene of several (unrelated) clades • We have to relax the definition for taking into account: • Low-level gene losses • Sequencing errors • Gene calls errors
Clade-specific marker genes Gene X • Gene X is a marker gene (for Clade Y) if X is a core gene for Y and X never appears outside Clade Y
The BactoChip: high-throughput microbial species identification With Olivier Jousson, Annalisa Ballarini
BactoChip: detecting single species With Olivier Jousson, Annalisa Ballarini
MetaPhlAn: inferring microbial abundancesfrom metagenomic data using marker genes • Map metagenomicreads to marker genes to infer microbial abundances • Normalizing for copy number, gene length, etc. Much faster than existing approaches as the marker gene database is ~50 times smaller than the whole microbial sequence DB Few hours instead of weeks for Illumina samples with 100Gb of sequence data MetaPhlAn:Metagenomic Phylogenetic Analysis http://huttenhower.sph.harvard.edu/metaphlan
MetaPhlAn: synthetic validation on log-normal abundances Summary of 8 synthetic communities composed by 2M reads coming from 200 organisms with log-normal distributed abundances concentrations Species-level Class-level Species level Class level
Whence enterotypes? Genera Species
Microbial community function and structure in the human microbiome: the story so far? • Who’s there varies even in health • What they’re doing doesn’t (as much) • Both correlate with niche • By the way: both change during disease and treatment • There are patterns in this variation • Function correlates with membership and phenotype • “Pathogenicity” correlates with lower prevalence • Membershipmeans species, strains, or variants • Patterns aren’t always as simple as enterotypes • ~1/3 to 2/3 of human metagenome characterized • Job security!
Ask both what you can do for your microbiomeand what your microbiome can do for you
Thanks! Human Microbiome Project Owen White George Weinstock Karen Nelson Joe Petrosino Mihai Pop Pat Schloss MakedonkaMitreva Erica Sodergren VivienBonazzi Jane Peterson Lita Proctor SaharAbubucker Yuzhen Ye Beltran Rodriguez-Mueller Jeremy Zucker QiandongZeng MathangiThiagarajan Brandi Cantarel Maria Rivera Barbara Methe Bill Klimke Daniel Haft Dirk Gevers Nicola Segata Xochi Morgan Levi Waldron HMP Metabolic Reconstruction Bruce Birren Mark Daly Doyle Ward Eric Alm Ashlee Earl Lisa Cosimi Ramnik Xavier Harry Sokol Joseph Moon FahSathira Tim Tickle Jacques Izard Olivier Jousson Annalisa Ballarini JeroenRaes Karoline Faust Wendy Garrett Michelle Rooks VagheeshNarasimhan Josh Reyes http://huttenhower.sph.harvard.edu
Linking function to community composition Plus ubiquitous pathways: transcription, translation, cell wall, portions of central carbon metabolism… ← 52 posterior fornix microbiomes → Phosphate and peptide transport Lactobacillus crispatus Lactobacillus jensenii Sugar transport Embden-Meyerhof glycolysis, phosphotransferases Lactobacillus gasseri Lactobacillus iners F-type ATPase, THF ← Taxa and correlated metabolic pathways → AA and small molecule biosynthesis Gardnerella/Atopobium Candida/Bifidobacterium Eukaryotic pathways
Linking communities to host phenotype Top correlates with BMI in stool Body Mass Index Normalized relative abundance Vaginal pH (posterior fornix) Vaginal pH, community metabolism, and community composition represent a strong, direct link between phenotype and function in these data. Vaginal pH (posterior fornix)