Download
1 / 42
420 likes | 652 Views
Building Analysis and Visualization Infrastructure for the Geosciences Mary Haley Computing in Atmospheric Sciences 2001 Annecy, France Tuesday, 30 October 2001. NCAR Command Language. Introduction to NCL Brief history of NCL CCSM-NCL collaboration Other projects Future directions.

E N D
Building Analysis andVisualization Infrastructure forthe GeosciencesMary HaleyComputing in Atmospheric Sciences 2001Annecy, FranceTuesday, 30 October 2001
NCAR Command Language • Introduction to NCL • Brief history of NCL • CCSM-NCL collaboration • Other projects • Future directions Scientific Computing Division National Center for Atmospheric Research
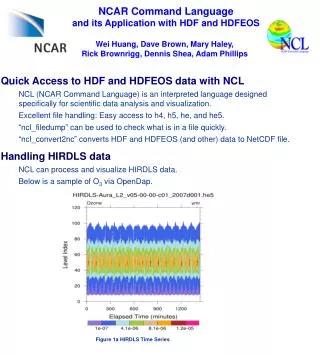
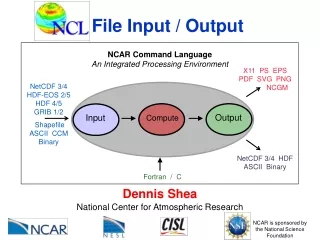
Introduction to NCL • A scripting language designed for the analysis and visualization of data • Powerful in 3 areas: • File input and output • Data processing • Graphics • Based on netCDF model • Runs on many UNIX systems (Compaq, IBM, PC/Linux, PC/Windows, SGI, Sun) • Free to the public Scientific Computing Division National Center for Atmospheric Research
Brief history of NCL Scientific Computing Division National Center for Atmospheric Research
CCSM-NCL collaboration • What is the CCSM? • Requirements for CCSM post-processor • NCL’s role • Support for CCSM-NCL users • Contributions and examples from climate community • If I say “CSM”, I mean “CCSM”. Scientific Computing Division National Center for Atmospheric Research
What is the CCSM? • A fully-coupled, global climate model that provides state-of-the-art computer simulations of the earth’s past, present, and future climate states. Scientific Computing Division National Center for Atmospheric Research
Requirements for the CCSMpost-processor • Read/write certain portable data formats (netCDF, HDF, HDF-EOS) • Read GRIB • Built-in climate analysis functions • Interface w/user Fortran/C codes and external libraries (i.e. IMSL) • Generate different types of graphics in publication-quality formats Scientific Computing Division National Center for Atmospheric Research
BEFORE Read/write netCDF, HDF, ASCII, binary Read GRIB Functions for querying input files AFTER Read GRIB files containing ECMWF complex coefficients Read CCM history tape files Read multiple files with one statement NCL’s role:file input and output Scientific Computing Division National Center for Atmospheric Research
BEFORE Over 100 routines Standard math calculations Handle missing data Access Fortran & C routines AFTER Over 400 routines Spherical harmonics Scalar and vector regridding 1, 2, 3D interpolations Script to simplify Fortran/C routine access NCL’s role:data processing Scientific Computing Division National Center for Atmospheric Research
NCL’s role:data processing (cont’d) • Sea level pressure computation • Spectral/cross-spectral analysis • Geopotential height computation for CCM hybrid coordinates • Empirical orthogonal functions, singular value decomposition • Other non-CCSM specific functions Scientific Computing Division National Center for Atmospheric Research
BEFORE Objected-oriented interface Contours, XY plots, vectors, streamlines, maps Flexibility via hundreds of resources AFTER Suite of plotting templates Highly-stylized Takes advantage of meta data NCL’s role:graphics Scientific Computing Division National Center for Atmospheric Research
Scientific Computing Division National Center for Atmospheric Research
Support for CCSM-NCL users • Documentation • CCSM Support Network web site • Consulting • NCL workshops • ncl-talk email list Scientific Computing Division National Center for Atmospheric Research
Contributions from users • Over 100 functions • zonal averages • climatologies • interannual variability • specialized plotting scripts • wave number spectra • diagnostics package Scientific Computing Division National Center for Atmospheric Research
Real world examples • Matthew Huber, Danish Center for Earth System Science • Joel Norris, Scripps Institute of Oceanography • Adam Phillips, Dennis Shea, Mark Stevens, CGD • Bjorn Stevens, UCLA • Greg Thompson, Research Applications Program Scientific Computing Division National Center for Atmospheric Research
AMWG diagnostics package • Written completely in NCL • Produces over 475 postscript plots and tables in a variety of formats from CCSM monthly netCDF files • Used to compare two CCSM model simulations or a model simulation to observational and reanalysis data Scientific Computing Division National Center for Atmospheric Research
Other current projects • Weather Research and Forecast Model • Community Data Portal • High resolution maps • Other ports Scientific Computing Division National Center for Atmospheric Research
WRF Model • Next-generation mesoscale forecast model • NCL’s role • multi-model comparison • real-time weather forecasting plots • horizontal and vertical cross sections • skew-T plots • convert WRF data to vis5D data Scientific Computing Division National Center for Atmospheric Research
Community Data Portal • Data Server Pilot Projects • Live Access Server (LAS) • Distributed Oceanographic Data System – (DODS) • NCL acts as middleware • DSS Reanalysis II is one such project • Other data portals in the works (Regional Climate Data Access System, Vegetation and Ecosystem modeling/analysis) Scientific Computing Division National Center for Atmospheric Research
Future directions • Mesoscale Model (MM5) - terrain-following sigma-coordinate model designed to simulate or predict mesoscale and regional-scale atmospheric circulation (Penn State, NCAR) • Earth System Grid - virtual collaborative environment that links distributed centers, users, models, and data. Sponsored by DOE Office of Science, involves 5 laboratories and one university Scientific Computing Division National Center for Atmospheric Research
RANGS/GSHHS Coastline Database • GSHHS (Global Self-consistent Hierarchical High-Resolution Coastlines), created by Paul Wessel and Walter Smith. • RANGS (Regionally Accessible Nested Global Shorelines), created by Rainer Feistel. • Expressed to 0.000001 degrees of lat/lon (about 0.1 meters). • Actual accuracy is more like 500 meters. • Points in database are about 300 meters apart. Scientific Computing Division National Center for Atmospheric Research
Future directions (cont’d) • New functionality in NCL • Curvilinear coordinates • HDF 5 • More robust 3D capability • Vis5D, a visualization system for large 5-D gridded data sets such as those produced by numerical weather models • Other ports (Mac OSX) Scientific Computing Division National Center for Atmospheric Research
URLS • NCL Home Page http://ngwww.ucar.edu/ncl/ • CCSM Support Network http://www.cgd.ucar.edu/csm/support/ • Me (haley@ucar.edu) Scientific Computing Division National Center for Atmospheric Research
National Center for Atmospheric Research Boulder, Colorado United States