Download
1 / 63
630 likes | 794 Views
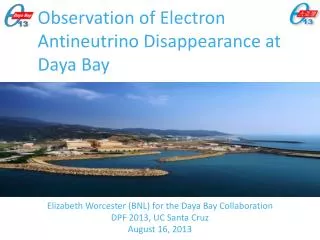
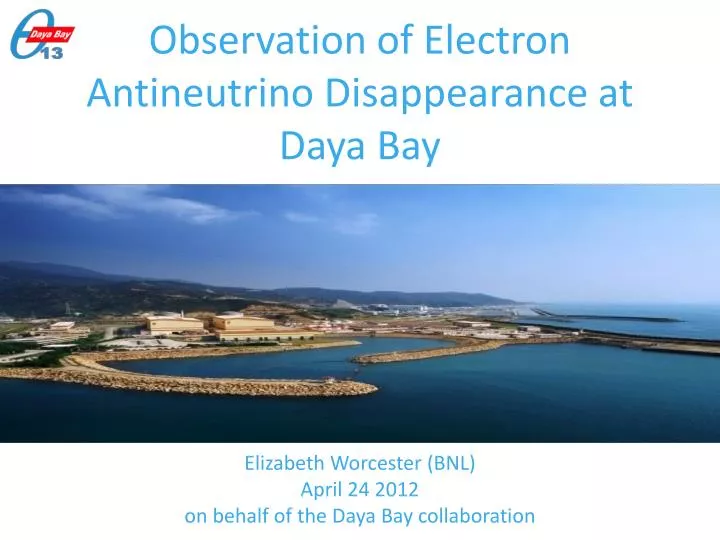
Observation of Electron Antineutrino Disappearance at Daya Bay. Elizabeth Worcester (BNL) April 24 2012 on behalf of the Daya Bay collaboration. Neutrino Oscillation. Mass eigenstates ≠ flavor eigenstates Flavor composition of neutrinos change as they propagate.

E N D
Observation of Electron Antineutrino Disappearance at Daya Bay Elizabeth Worcester (BNL) April 24 2012 on behalf of the Daya Bay collaboration
Neutrino Oscillation • Mass eigenstates ≠ flavor eigenstates • Flavor composition of neutrinos change as they propagate Amplitude depends on mixing angle θ. Oscillation frequency depends on Δm2, baseline, and energy. ETW UPenn Seminar
3 Neutrino Oscillation: PMNS Matrix θ13 only mixing angle not previously well-established θ12 ≈ 35o Solar Long-Baseline Reactor θ23 ≈ 45o Atmospheric Accelerator θ13 < 10o Short-Baseline Reactor Accelerator ETW UPenn Seminar
Recent Experiments Suggest Non-Zero θ13 Combined results > 3σ from θ13= 0 No single measurement > 2.5 σ from θ13= 0 T2K: 0.03(0.04) < sin2(2θ13) < 0.28(0.34), PRL 107, 041801 (2011) MINOS: 2sin2(θ23)sin2(2θ13) = , PRL 107, 181802 (2011) Double Chooz: sin2(2θ13) = 0.086 ± 0.041(stat) ± 0.030(syst), PRL 108, 131801 (2012) ETW UPenn Seminar
Daya Bay Experiment Asia (20) IHEP, Beijing Normal Univ., Chengdu Univ. of Sci and Tech, CGNPG, CIAE, Dongguan Polytech, Nanjing Univ., Nankai Univ., NCEPU, Shandong Univ., Shanghai Jiao Tong Univ., Shenzhen Univ., Tsinghua Univ., USTC, Zhongshan Univ., Univ. of Hong Kong, Chinese Univ. of Hong Kong, National Taiwan Univ., National Chiao Tung Univ., National United Univ. North America (16) Brookhaven Natl’ Lab, Cal Tech, Cincinnati, Houston, Illinois Institute of Technology, Iowa State, Lawrence Berkeley Natl’ Lab, Princeton, Rensselaer Polytech, UC Berkeley, UCLA, Wisconsin, William & Mary, Virginia Tech, Illinois, Siena College Europe (2) Charles Univ., Dubna ~230 collaborators ETW UPenn Seminar
Reactor Neutrino Oscillation KamLAND Daya Bay Far Site ETW UPenn Seminar
Reactor Neutrino Relative Measurement • Absolute reactor flux: • Largest source of systematic uncertainty in previous measurements • Relative measurement: • Near detectors measure flux • Absolute uncertainties cancel in near/far ratio Near detectors constrain flux Far detectors measure oscillation ETW UPenn Seminar
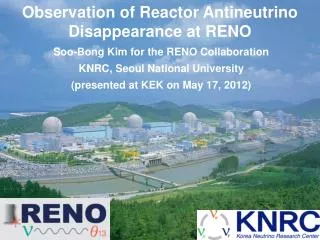
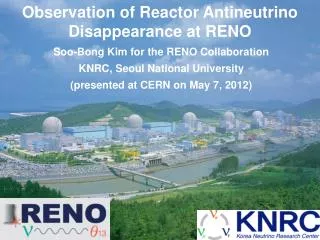
Daya Bay SiteGuangdong, China Entrance to Daya Bay experiment tunnels Daya Bay NPP 2.9GW2 Ling AoNPP 2.9GW2 Ling Ao II NPP 2.9GW2 6 reactors: 17.4 GW (thermal) total power produce ~2×10²⁰ antineutrinos / s / GW Mountains shield detectors from cosmic ray backgrounds ETW UPenn Seminar
Daya Bay Experiment Layout Validation: - Three independent calculations - Cross-check survey - Consistent with reactor plant and design plans Detailed Survey: - GPS above ground - Total Station underground - Final precision: 28mm ETW UPenn Seminar
Daya Bay Experiment Halls EH1 Entrance to tunnels EH2 EH3 ETW UPenn Seminar
Antineutrino Detection Inverse β-decay (IBD): Prompt positron: Carries antineutrino energy Ee+≈Eν – 0.8 MeV Delayed neutron capture: Efficiently tags antineutrino signal Gd(n,γ) ~8 MeV ~30μs Prompt + Delayed coincidence provides distinctive signature ETW UPenn Seminar
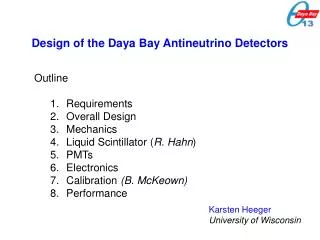
Antineutrino Detectors (ADs) Automated calibration unit (ACU) • 6 “functionally identical” ADs • ~110 tons total • ~20 tons Gd-doped LS • ~20 tons LS • ~40 tons mineral oil • 192 8” PMTs Gd-doped liquid scintillator Liquid scintillator γ-catcher 3.1 m Reflectors at top and bottom of cylinder Mineral oil PMTs 5 m ETW UPenn Seminar
Interior of AD ETW UPenn Seminar
AD Assembly 4m AV SSV Bottomreflector PMTs 3m AV Topreflector SSV lid Leak check ACU ETW UPenn Seminar
Muon Tagging System • Water Pool • At least 2.5 m of purified water surrounds each AD • Water acts as shield and as Cherenkov detector • 2 optically separated regions: IWS, OWS • 288 8” PMTs in each near hall • 384 8” PMTs in Far Hall • 4-layer RPC modules above pool • 54 modules in each near hall • 81 modules in Far Hall ETW UPenn Seminar
Background Suppression from Water Shield Reconstructed position of AD single events during filling of pool Air Water ETW UPenn Seminar
EH1 Pool Filled ETW UPenn Seminar
EH1 Completed Began taking physics data September 23, 2011 ETW UPenn Seminar
EH2 and EH3 EH3: began 3-AD operation on December 24, 2011 EH2: began 1-AD operation on November 5, 2011 • Two more ADs in production • Will be installed summer/fall 2012 ETW UPenn Seminar
Data Collection • Two Detector Comparison: • Sep. 23, 2011 – Dec. 23, 2011 • Side-by-side comparison of 2 EH1 detectors • Demonstrated detector systematics better than requirements • F.P. An et al., arXiv:1202.6181 (2012) • Oscillation Analysis: • Dec. 24, 2011 – Feb. 17, 2012 • All 3 halls (6 ADs) operating • DAQ uptime: >97% • Antineutrino data: ~89% • F.P. An et al., PRL108, 171803 (2012); arXiv:1203.1669 EH1 EH2 EH3 ETW UPenn Seminar
Trigger Thresholds • 2 AD Triggers • Digital trigger: >45 PMTs • Analog trigger: AD PMT sum > 0.4 MeV • Muon Triggers • Inner water pool: >6 PMTs • Outer water pool: >7 PMTs • RPC: ¾ RPC layers in module Digital Trigger (Nhit) Analog Trigger (Esum) Minimum energy for prompt antineutrino signature is ~0.9 MeV. No measureable trigger inefficiency above 0.7 MeV. ETW UPenn Seminar
Data Analysis Strategy Number of anti-neutrinos detected Detector target mass Distance from reactor to detector Detector efficiency Oscillation survival probability • Multiple Independent Analyses: • Common data set • Different • Energy calibration/reconstruction • Event selection/efficiency estimation • Background estimation • θ13 rate analysis • All yield consistent results • Only one analysis presented here • Blinded information: • True target masses • True distance from reactors to detectors • True reactor flux history ETW UPenn Seminar
Calibration: ACUs Each ACU contains 3 sources on turntable: 68Ge source • 0 KE e+ = 2×0.511 MeV γ’s • 10 Hz 241Am-13C neutron source • 3.5 MeV n without γ • 0.5 Hz 60Cogamma source • 1.173+1.332 MeV γ • 100 Hz LEDdiffuser ball • 500 Hz R=0 R=1.35m R=1.7725m ACUs deploy sources along 3 axes: center of target, edge of target, center of gamma catcher ETW UPenn Seminar
Calibration: PMT Gain Use LED to measure charge from single photons PMT Charge vs Time ADC charge from single photon PMT gain calibration is updated weekly ETW UPenn Seminar
Calibration: Energy Scale 60Co Source • Measure energy scale (photoelectrons/MeV) in two ways • 60Co source • ~2.5 MeV • Deployed at center of detector • Calibration performed weekly • Correct for energy nonlinearity using Am-C neutron source • Gd capture of spallation neutrons • ~8 MeV • Evenly distributed throughout detector • Calibration data acquired concurrently with physics data • Calibration updated frequently (~daily) Spallation Neutrons ETW UPenn Seminar
Calibration: Stability of Energy Scale 60Cobalt Source (updated weekly) Spallation Neutrons (updated daily) Detector Tests ETW UPenn Seminar
Calibration: Detector Uniformity Use calibration sources along 3 axes to measure detector uniformity • Example: 60Co source • also use nGd • Response varies across detector • Uniformity consistent between detectors • Correction improves uniformity After Correction ETW UPenn Seminar
Single Event Spectrum Rates: ~65 Hz in each detector (Energy > 0.7 MeV) • Sources: • Stainless Steel: • U/Th chains • PMTs: • 40K, U/Th chains • Scintillator: • Radon/U/Th chains ETW UPenn Seminar
Antineutrino (IBD) Event Selection Prompt positron + delayed neutron correlated signal is signature for IBD events • IBD Selection • Reject “flashers” • Prompt positron: 0.7 MeV < Ep < 12 MeV • Delayed neutron: 6.0 MeV < Ed < 12 MeV • Capture Time: 1 μs< Δt < 200 μs • Muon Veto • Pool muon: veto following 0.6 ms • AD muon (> 20 MeV): veto following 1 ms • AD shower muon (>2.5 GeV): veto following 1 s • Multiplicity • No other signal > 0.7 MeV within ±200 μsof IBD ETW UPenn Seminar
PMT Light Emission (Flashers) • Flashing PMTs: • Instrumental background from ~5% of PMTS • Lights up opposite side of detector • Easily discriminated from normal signals Quadrant 1 (contains “hottest” PMT) (opposite side of AD) ETW UPenn Seminar
Flasher Discrimination Neutrinos Flashers FID = log10((MaxQ/0.45)2 + (Quad)2) MaxQ= maxQ/sumQ Quadrant = Q3/(Q2+Q4) Inefficiency to antineutrino signal: 0.024% 0.006%(stat) Contamination: < 0.01% ETW UPenn Seminar
Correlated IBD Signature IBD Data not bg subtracted IBD Clear separation of antineutrino IBD events from most other signals ETW UPenn Seminar
Delayed Energy Cut • Largest source of systematic uncertainty • Use variations in energy peaks to constrain relative efficiency • Efficiency variations estimated to be 0.12% nGd ETW UPenn Seminar
H/Gd Capture Ratio • 2nd largest source of systematic uncertainty • Capture time in each detector constrains H/Gd capture ratio • Am-C source neutron-capture time distributionsconstrain uncertainty in relative H/Gd capture efficiency to <0.1% between detectors ETW UPenn Seminar
IBD Prompt Event Locations x-y Location ETW UPenn Seminar
Background: Accidentals Two unrelated single events can mimic an IBD coincidence signal Rate and spectrum can be accurately predicted from single event data ETW UPenn Seminar
Eμ>4 GeV (visible) Background: β-n decay 9Li + 8He IBD events • Generated by cosmic rays • Long-lived • Mimic IBD coincidence signal • Fit time since last muon with known decay times for 9Li and 8He • ~ 0.4%(0.2%) of far(near) signal Time since muon (s) 9Li τ1/2 = 178 ms, Q = 13.6 MeV 8He τ1/2 = 119 ms, Q = 10.6 MeV ETW UPenn Seminar
Background: Fast neutrons • Generated by cosmic rays • High energy • Mimic IBD coincidence signal • Prompt: neutron collides/stops in target • Delayed: neutron captures on Gd ~0.06% (0.1%) of far (near) signal Constrain fast-n rate using IBD-like signals with high energy Validate with fast-n events tagged by muon veto. ETW UPenn Seminar
Background: 241Am-13C neutrons Simulated neutron capture position • 0.5 Hz neutron source in ACUs • Mimics IBD coincidence signal • Prompt: neutron inelastic scattering on iron • Delayed: neutron capture on iron • Both γ enter scintillator region • Measure uncorrelated gamma rays from ACU in data • Estimate correlated rate from MC • 0.2 ± 0.2 /AD/day • ~0.3% (0.03%) of far (near) signal ETW UPenn Seminar
Background: 13C(α,n)16O Potential α sources: Radon, U, Th decay chain Two kinds of correlated background: Prompt: neutron scattering Delayed: neutron capture on Gd OR Prompt: γ from excited state of 160 Delayed: neutron capture on Gd • α rate measured in data • neutron yield per α calculated • 0.04% (0.006%) of far (near) signal ETW UPenn Seminar
Data Summary ETW UPenn Seminar
Reactor Flux Antineutrino flux is estimated for each reactor core: (negligible impact on far/near oscillation measurement) Isotope fission rates vs. reactor burnup • Reactor operators provide: • Thermal power data (Wth) • Relative isotope fractions (fi) • Nuclear theory/experiment provide: • Energy released per fission (ei) • V. Kopekin et al., Phys. Atom. Nucl. 67, 1892 (2004) • Antineutrino spectra per fission (Si(Eν)) • K. Schreckenbach et al., Phys. Lett. B160, 325 (1985) • A. A. Hahn et al., Phys. Lett. B218, 365 (1989) • P. Vogel et al., Phys. Rev. C24, 1543 (1981) • T. Mueller et al., Phys. Rev. C83, 054615 (2011) • P. Huber, Phys. Rev. C84, 024617 (2011) ETW UPenn Seminar
Antineutrino Rate vs. Time Detected rate strongly correlated with reactor flux expectations. Predicted Rate:(in figure) - Assumes no oscillation - Normalization is determined by fit to data - Absolute normalization is within a few percent of expectations ETW UPenn Seminar
Prompt Positron Spectra EH1 EH2 EH3 57910 signal candidates 22466 signal candidates 10416 signal candidates • BG/Signal ratio: • 2% at near sites • 5% at far site ETW UPenn Seminar
Systematic Uncertainties For oscillation analysis, only uncorrelated uncertainties are used. • Largest systematic uncertainties: • Delayed energy cut • Gd capture ratio • Smaller than far site statistical uncertainty (1%) Influence of uncorrelated reactor systematics (0.8%) is only 0.04% on oscillation analysis. ETW UPenn Seminar
Far vs. Near Comparison • Mn are the measured, background-subtracted rates in each detector. • Weights αi, βiare determined from baselines and reactor fluxes. R = 0.940 ± 0.011 (stat) ± 0.004 (syst) Clear observation of far site deficit Spectral distortion consistent with oscillation.* * Caveat: Spectral systematics not fully studied; θ13 value from shape analysis not recommended. ETW UPenn Seminar
sin2(2θ13): Rate Analysis sin22θ13 = 0 excluded at 5.2σ • Uses standard χ2 approach • χ2/DOF = 4.26/4 • Far vs. near relative measurement • Absolute rate is not constrained • Consistent results obtained by independent analyses, differentreactor flux models sin22θ13 = 0.092 ± 0.016 (stat) ± 0.005 (syst) ETW UPenn Seminar
sin2(2θ13): Global Results ETW UPenn Seminar
Effect on Experimental Neutrino Program LBNE Large value of sin2(2θ13) increases size of νe appearance sample AND decreases size of CP violating asymmetry. It is still hard to see CP violation! ETW UPenn Seminar
Summary The Daya Bay reactor neutrino experiment has made an unambiguous observation of reactor electron-antineutrino disappearance at ~2 km: R = 0.940 ± 0.011 (stat) ± 0.004 (syst) Interpretation of disappearance as neutrino oscillation yields sin22θ13 = 0.092 ± 0.016 (stat) ± 0.005 (syst) ruling out sin2(2θ13)=0 at 5.2 standard deviations. Data-taking continues. Expect updated results with more statistics in near future. Construction of final two ADs is underway. Expect installation summer/fall 2012. ETW UPenn Seminar