Download
1 / 19
190 likes | 347 Views
Operational Great Lakes Ice Charts and On-line Climatology. 18 th Annual Canada/US Great Lakes Operational Meteorology Workshop Toronto Ontario Marie-France Gauthier Canadian Ice Service March 22-24, 2010. Contents. The North American Ice Service (NAIS)

E N D
Operational Great Lakes Ice Charts and On-line Climatology 18th Annual Canada/US Great Lakes Operational Meteorology Workshop Toronto Ontario Marie-France Gauthier Canadian Ice Service March 22-24, 2010
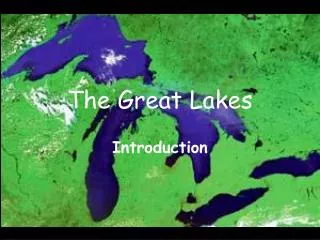
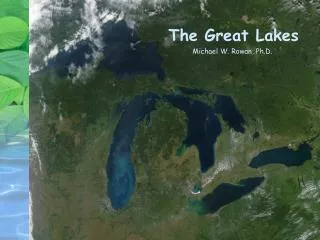
Contents • The North American Ice Service (NAIS) • Operational Focus…Ice Information and Data Integration • Great Lakes Ice Climatology • Summary
North American Ice Service • Our Vision • To create a harmonized suite of products and services for ice information for North American waters to serve the needs of users for safety of navigation and informed decision making • Our History • Canada-US Joint Ice Working Group (JIWG) meeting for about 20 years • Signed a“North American Ice Service” agreement in June 2004
North American Ice Service • Goals • Support safe and efficient maritime operations • Meet national security requirements • Deliver ice information for numerical weather, ocean and environmental prediction • Support climate change research • Provide sound ice knowledge for decision making and policy development • Improve national ice information quality and efficiency • Provide national backup capabilities
Climatology Weather Previous Charts Operational Focus… Ice Information and Data Integration
VISUAL RECONNAISSANCE ICE SERVICE SPECIALIST ON-BOARD Operational Focus… Ice Information and Data Integration SATELLITE
NAIS Great Lakes Charts (Same week in February, 2004)
Operational Focus… Ice Information and Data Integration • More than ice charts • Ice warning and daily forecast: FICN19CWIS • Seasonal Outlook: FECN19CWIS • Issued once at the beginning of the season and update every two weeks • Common Production System • POLARIS • Latest ArcGIS technology • Various map projection • Better ice models • Automated chart generation • Winter 2010-11
Ice Climatology & Archive • Sea Ice since 1968 • Lake Ice since 1972 CIS Archive Ice Graph Tool
Great Lakes Ice Climatology Historical Ice Coverage for Mid-March since 1973
Great Lakes Ice ClimatologyTotal Accumulated Ice Coverage - Dec. 4 to Mar. 12
Great Lakes Ice ClimatologyDeparture from Normal Total Concentration
MAXIMUM ICE CONDITIONS - FEBRUARY1979 MINIMUM ICE CONDITIONS -MARCH 2002
Climate Variability • Total ice cover on the Great Lakes has shown an overall decline of ~15% over the period 1973-2009. • Lake Superior has shown the greatest decrease in total ice cover (~20% over the last 37 years). • Lake Ontario has shown the smallest decrease in total ice cover (less than 10% over the last 37 years). • Last winter (2008/09) has shown that heavy ice cover years do still occur and that interannual variability is a big factor for ice cover on the Great Lakes.
Summary • The North American Ice Service is closely monitoring ice conditions on the Great Lakes. Providing information for the safety of all in Great Lakes waters is our primary concern. • Our suite of products includes daily forecast and ice chart, weekly climate ice chart, thirty day forecast, seasonal outlook and end of season summary. • While winters with easier than normal ice conditions have been more frequent in the last decade, Environment Canada expects that a large annual variability in the ice conditions over the Great Lakes will continue.
Oldest Great Lakes Chart in the CIS Archive THANK YOU FOR YOUR ATTENTION