Download
1 / 67
670 likes | 898 Views
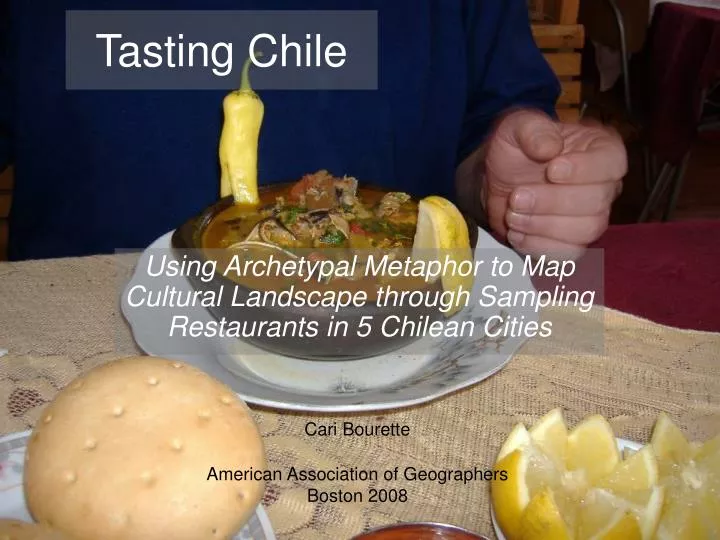
Tasting Chile. Using Archetypal Metaphor to Map Cultural Landscape through Sampling Restaurants in 5 Chilean Cities. Cari Bourette American Association of Geographers Boston 2008. Cultural Geography.

E N D
Tasting Chile Using Archetypal Metaphor to Map Cultural Landscape through Sampling Restaurants in 5 Chilean Cities Cari Bourette American Association of Geographers Boston 2008
Cultural Geography • The study of cultural identity, products and norms, with their variation across, and relations to, spaces and places. • Describing and analyzing the ways language, religion, economy, government, and other cultural phenomena vary or remain constant from one place to another. • Explaining how humans function spatially and how they distinguish themselves culturally from the “other” (Jordan, Domosh, and Rountree, eds. 1994).
Scope of This Study • Qualitatively rate cultural products, and analyze their variation across 5 cities in Chile • Describe and analyze ways observed cultural phenomena vary or remain constant from each of these cities to another
Overview • What is a Systems Approach? • Benefits of Quantifying Differences in attitudes/values/cultures • Restaurants as a Representative Place • Assessment Tool – The Compass Model • Comparing the 5 Cities “flavors” • Conclusion
What is a Systems Approach? • Observing/evaluating an Integrated Whole • May study how all parts affect each other– that is the entire system • Not concerned with theoretical isolated parts or individual pieces
Example in Physical Science • The actions of individual gas molecules on the surface of a balloon are for all practical purposes considered “random” • The relevant information is usually found by measuring the collective action of all of the molecules
Systems Approach and Societies Example questions for societies: • How does a society respond to an event? • How does culture shape a society and how does the society reinforce its culture? • How do the values of one culture group compare with another?
Limitations of Systems Approach with Societies The study of any group: • Tells us nothing of the beliefs, values, thoughts, or feelings of any individual within the group • Tells us nothing of the expected behavior of any individual within the group • Just like the gas molecules on the balloon, we are observing a system, and any conclusion regarding present or future behavior is a net effect of the whole.
Example – Simple Observations • Assumed a generally safe, relaxing place even though individuals present are strangers. • Although all individuals not involved, a violent place and group.
Benefits of Quantifying Group/Society Attitudes, Values, Culture • Clashes in culture groups or potential for escalation can be assessed and evaluated. • Qualitative observations of marginalization or other observed regional differences could be quantified and compared. • Level of socioeconomic stability or risk potential for destabilization could be assessed.
The Compass Model Using Archetypal Metaphor for Assessing and Analyzing Systems
Brief Background of “Compass” Model • Began as a conceptual model for describing events in general. • Further developed to describe and study qualitative, subjective data (primarily re: individuals and groups of people). • Categories are not precisely defined; they are understood through instruction and stories; they are metaphorical. • Modeled after simple, general, but “complete” world-views of pre-agricultural societies.
Archetypal Categories • Primary categories are based on such archetypal values as “Earth, Air, Fire, Water.” • Additional categories are drawn from Jungian archetypal models such as “Anima” and “Animus” (later renamed to “Receptive” and “Directed”). • Eight compass points are used as abbreviations for these categories.
Earth Receptive Somber Water Air Manic Directed Fire “Compass” of 4 Polarities N NE NW E W SE SW S
Demonstrated Benefits • The Compass System has been successfully applied in the work of A New Story Foundation (a not for profit researching sustainability) for assessing and forecasting periods of • heightened social / economic instability • heightened likelihood of geopolitical escalation
What about Place? • Places, being conceptual and subjective, are difficult to map. • Places, being unique, are difficult to compare with other places. • How can subjective, qualitative data about place be quantified so as to be meaningful and comparable with other places? • Could the “Compass” system be used to gather data on a subset of a place (e.g. a city’s restaurants)? How well would the results compare with general impressions of that place?
Restaurants as Representative Place • 60% fail within the first year • Patrons “vote” for success by their continued business • A successful restaurant must appeal or resonate with its clientele in décor, service, price range, as well as type and quality of food • Therefore a restaurant can represent the collective values or culture of its service area
Compass Model Categories Adapted for Social Spaces
4 Primary Categories Earth Water Air Fire
Stillness, quiet, calm Solid, stable Cold, cool Wood, stone, trees Colors – “Earth tones” i.e. browns, rusts, etc. Loudness, busyness, activity Volatile, unstable Hot, warm Colors – “Fiery” reds, “loud” colors N – Earth vs. S – Fire
Words, numbers, reason, logic Linear, well-defined Literally, of the air Dry, arid Colors – pastels, light colors Emotion, belief, intuition, imagination Ambiguous, fluid Literally, of the water Wet, humid Colors – blues, black, other dark colors (but not earth tones) E - Air vs. W - Water
Receptive Somber Earth Air Water Fire Manic Directed 4 Hybrid Categories
Welcoming, friendly, hospitable, nurturing Dainty, bite sized pieces Of relationships-- community, family, couple Colors – light pink, peach, combinations of Earth and Air colors (e.g. brown and yellow) Projective, lavish, abundant, extravagant Pertaining to the pursuit of instinctual enjoyment (food, drink, sex) Pertaining to “outdoors”-- hunting, warriors, etc. Colors – purple, combinations of Fire and Water colors (e.g. red and blue). NE - Receptive vs. SW - Directed
Chaotic, frenzied, messy, disordered Technology, fluorescent lights, trade, commerce Focused on future, endless possibilities Colors – orange, hot pink, neon green, combinations of Fire and Air colors, such as red and yellow. Strictly ordered; subdued, but eerie Dark, cold, wet places like caves Related to death, decay, the afterlife Focused on past, tradition Colors – grey, combinations of Earth and Water colors, such as blue-green. SE - Manic vs. NW - Somber
Tasting Chile Study • 5 Urban areas studied over one month. • Area restaurants were visited and rated (0-100) on the relative strength of eight categories reflected in overall ambience, i.e. the “affect” or feeling of the restaurant. • Data collected was compared with other observations of the area to test the feasibility of using this as a study method.
Summary, Santiago Observations • Capital city, center of commerce and industry, good public transportation • Highly globalized – McDonald’s, Pizza Hut, KFC, international cuisine. • Still has town square with entertainment. • Marginalization – poor, “projectized” section of town less kept up.
Comparison with Restaurant Data, Santiago • Santiago less calm and quiet (N) than Chile avg. • Santiago higher prevalence of communication with words and numbers, more intellectual (E). • Higher activity level/pace than Chile average (S).
Comparison with Restaurant Data, Santiago • More trade, commerce, technology (SE) than Chile average. • More welcoming to outsiders (NE). • Less focused on the past, and tradition (NW).
Santiago – Did it match? • How well did the collected restaurant data match what was otherwise observed regarding the city Santiago? Excellent Good Fair Poor X Not a lot of detail, but it matched very well.
Summary, Temuco Observations • Fair sized city (250,000 people) with shops and public transportation (collectivos). • Not as modernized as Santiago. • Cultural center for the Mapuche people. • Proud, but marginalized & oppressed people. • American Indian nation not conquered by the Spanish. • Characterized in the literature as “fierce”
Comparison with Restaurant Data, Temuco • Temuco is similar to the average for the cities studied, but has a slightly slower pace (N). • Temuco showed a higher use of communication with imagery than with words (W vs. E).
Comparison with Restaurant Data, Temuco • Higher emphasis on outdoors, cowboys, warriors, etc (SW) than avg. for cities studied. • Less welcoming of strangers than avg. (NE). • Less technologically oriented (SE). • Higher emphasis on the past or tradition (NW).
Temuco – Did it match? • How well did the collected restaurant data match what was otherwise observed regarding the city Temuco? Excellent Good Fair Poor X Data matched general observations.
Summary, Ancud Observations • Small island fishing town. • Some catering to tourists, but not aggressively sought out. • Suspicious of outsiders, especially land developers. • Cultural center for the Huilliche. • Conquered by the Spanish, very little left of a Huilliche people or culture.