Download
1 / 15
150 likes | 233 Views
Suitability of PCOP to analyse the expression dependence from microarray data. http://ibb.uab.es/revresearch.

E N D
Suitability of PCOP to analyse the expression dependence from microarray data. http://ibb.uab.es/revresearch Huerta, M., Cedano, J. and Querol, E. (2007) Analysis of non-linear relation between expression profiles by the Principal Curves of Oriented-Points approach. J Bioinform Comput Biol, 6:367-386.
Objectives • Provide powerful tools for studying the non-linear dependences among gene expressions focussed in researcher genes of interest. • Taking advantage of the high-throughput capability of microarray technology.
The PCOP calculus • The analysed variables with the PCOP method can be independent because the method uses a hidden variable for ordering the data. • PCOP is defined using the generalisation, at the local level, of the Principal-Components variance properties. The set of POPs obtained (PC at local level) makes up the PCOP or inner pattern of the data cloud.
The PCOP is a very suitable analysis for recognising non-lineal patterns among independent variables. PCOP POPx
Gene-expression relationships detectable by PCOP analysis. • Positively co-expressed genes. • Negatively co-expressed genes. • Genes mutually excluding in their expression. • genes which are dependent in their expression only because one of the genes must be over-expressed or under-expressed to activate the expression fluctuations of the other gene. • Non-linear correlated genes (general).
Very suitable for finding gene expression relationships using asynchronous data. • The microarray sample-series can be from: • Temporal series, useful to study synchronous cellular events. • Serial analysis of gene-expression experiments under different conditions (i.e., chemotherapy, temperature, radiation, starvation, etc.) more useful for studying asynchronous events.
One of the main keys of the PCOP is the calculus of the uncorrelation factor. • The Variance explained by the curve: Permits one to know if the Principal Curve is able to follow the sample-cloud tendency. Goes up when the sample cloud has a regular behaviour being well identified by the Principal Curve. • Residual Variance: The degree of dispersion of the samples around the Principal Curve. • The Generalized Total Variance: The sum of these two dispersion parameters. • f factor: RV divided by the GTV
Example of microarray analysis. • the profiles of 9703 cDNAS representing ~8000 unique genes of 60 cell lines, in relation to the activity profiles of 1400 drugs. They provide a resulting table of 1376 genes and 118 compounds with the most representative substances and genes normalised for the 60 cell lines (a suitable data for knowledge discovery using our tools)
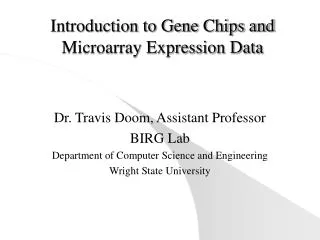
Correlation graph and minimum-spanning-tree among the same microarray gene-expressions using R2 correletion or the f value provided by the PCOP calculus. ( PCOP )
New gene-relations are revealed using the PCOP f factor. • If we try to relate the genes CDKN2A (P16) and CDKN1A (P21), basing ourselves only on linear correlations, no genes are reflected in the minimum spanning tree, but if we consider the non-linear correlations(PCOP), TP53 and GADD45A are crossed, reflecting that TP53 is a pivotal element to determine the function of this sub-set of genes. For instance, the p53/p21 pathway is responsible for glycolated Collagen II-induced apoptosis, and p53/p21 coordinated activation with CDKN2A (P16) induces cell senescence (Chen et al 2006). Huerta, M., Cedano, J. and Querol, E. (2007) Analysis of non-linear relation between expression profiles by the Principal Curves of Oriented-Points approach. J Bioinform Comput Biol, 6:367-386.
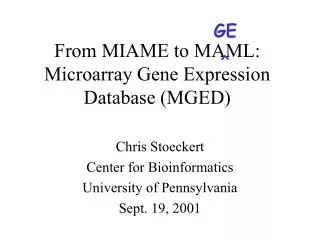
Minimum spanning tree among the same microarray genes using R2 and the f value provided by the PCOP calculus.
New gene-relations are revealed using the PCOP f factor. • Our method shows the TP53 as a central hub linked to a multitude of ohter proteins known to be involved in controlling important biological processes and not as a side branch of a subcluster as it appears when the links among genes are estimated using classical approaches.
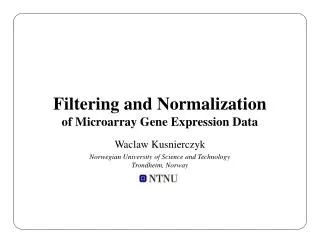
Graph and Minimum spanning tree among the same microarray genes using R2 and the f value provided by the PCOP calculus. Important regulators of cell cycle progression. Involved in excision repair of DNA damage. Stabilizer of p53. Cell cycle regulation, interacts with tumour supperessor protein Rb. Growth arrest, DNA-damage inducible. Cyclin-dependent kinase inhibitor, tighly controlled by p53.
The non-linear expression-relationships can be now analysed in detail.
Bibliografy • Delicado, P. (2001) Another look at principal curves and surfaces. J. Multivariate Anal., 77, 84-116. • Delicado, P. and Huerta, M. (2003) Principal curves of oriented points: Theoretical and computational improvements. Computation. Stat., 18, 293-315. • Huerta, M., Cedano, J. and Querol, E. (2007) Analysis of non-linear relation between expression profiles by the Principal Curves of Oriented-Points approach. J Bioinform Comput Biol, 6:367-386.