Download

1 / 16
200 likes | 270 Views
Learn how to optimize a portfolio by balancing returns and risks of different assets to enhance the reward-variability ratio (Sharpe ratio) using the concepts of minimum-variance combinations and correlation coefficients. Understand the steps to calculate the weights for an optimal risky portfolio with two assets, considering their expected returns and standard deviations.

E N D
1. E(rc) = wE(rp) + (1 - w)rf 2. c = w p c= complete or combined portfolio W is the weight on the risky asset Review • Mix one risky asset with the risk-free asset
Example • Suppose as an investor, you want to invest $10000 • There are 2 assets to pick from: S&P500 index and the risk-free T-bill • For S&P500, the annual return from 1980-2005 is around 10.5%, standard deviation is 15% annually • For the risk-free, one-year Treasury security is about 3%
Possible Combinations for S&P500 and T-bill E(r) E(rp) = 10.5% P E(rc) = 8% C rf = 3% F 0 c 15%
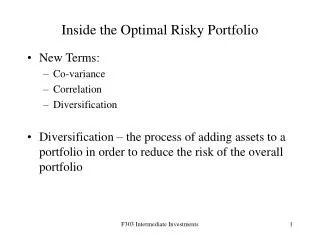
New question • Now introduce two risky assets, how can we find the optimal mix between the two to form a new portfolio p so that we can improve upon the reward-variability ratio (Sharpe ratio):
A new asset: real estate • Average annual housing price increases from 1995-2004 around NYC is 7.5%, standard deviation is 8% • Correlation coefficient between S&P500 and housing return is –0.3
Two-Security Portfolios p withDifferent Correlations E(r) 10.5% = -1 =- .3 7.5% = -1 = 1 St. Dev 8% 15%
Sec 1 E(r1) = .105 = .15 = -.3 12 Sec 2 E(r2) = .075 = .08 2 Minimum-Variance Combination 1 s22 - Cov(r1r2) = W1 s2 s2 - 2Cov(r1r2) + 2 1 W2 = (1 - W1)
(.08)2 - (-.3)(.15)(.08) = W1 (.15)2 + (.08)2 - 2(-.3)(.15)(.08) W1 = .277 W2 = (1 - .277) = .723 Minimum-Variance Combination: = -.03
Minimum -Variance: Return and Risk with = -.3 rp = .277(.105) + .723(.075) = .08 = [(.277)2(.15)2 + (.723)2(.08)2 + p 1/2 2(.277)(.723)(-.3)(.15)(.08)] s = .06 p
Optimal Risk Portfolio • To achieve the optimal portfolio, we need to find the weights for both risky assets in the portfolio, the way to find them is to maximize the following: Where p stands for the optimal portfolio. The optimal portfolio weights are given:
Solution for the weights of the optimal risky portfolio with two risky assets (asset 1 and 2)
Example • Risk-free rate as 3% • Risky asset one has expected return as 10.5%, standard deviation as 15% • The return-risk tradeoff for the above 2 assets: • Reward-variability ratio is 0.5
The new risky portfolio p • By investing 33% in risky asset S&P500 and 67% in housing, the new risky portfolio has expected return as: 0.33*10.5%+0.67*7.5% = 8.5%, the standard deviation as p= [w1212 + w2222 + 2W1W2 Cov(r1r2)]1/2 =6.1%
2. the second step, combining the new risky portfolio and the risk-free asset, the return and risk tradeoff (CAL line) line becomes: