Download
1 / 17
230 likes | 708 Views
Chapter 10 Statistical Inference About Means and Proportions With Two Populations. Estimation of the Difference between the Means of Two Populations: Independent Samples Hypothesis Tests about the Difference between the Means of Two Populations: Independent Samples

E N D
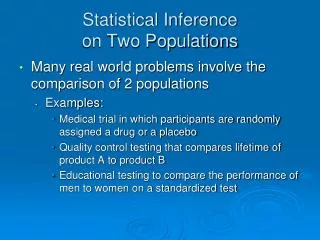
Chapter 10 Statistical Inference About Means and Proportions With Two Populations • Estimation of the Difference between the Means of Two Populations: Independent Samples • Hypothesis Tests about the Difference between the Means of Two Populations: Independent Samples • Inference about the Difference between the Means of Two Populations: Matched Samples • Inference about the Difference between the Proportions of Two Populations
Estimation of the Difference Between the Means of Two Populations: Independent Samples • Point Estimator of the Difference between the Means of Two Populations • Sampling Distribution • Interval Estimate of Large-Sample Case • Interval Estimate of Small-Sample Case
Point Estimator of the Difference Betweenthe Means of Two Populations • Let 1 equal the mean of population 1 and 2 equal the mean of population 2. • The difference between the two population means is 1 - 2. • To estimate 1 - 2, we will select a simple random sample of size n1 from population 1 and a simple random sample of size n2 from population 2. • Let equal the mean of sample 1 and equal the mean of sample 2. • The point estimator of the difference between the means of the populations 1 and 2 is .
Sampling Distribution of • The sampling distribution of has the following properties. Expected Value: Standard Deviation: where 1 = standard deviation of population 1 2 = standard deviation of population 2 n1 = sample size from population n2 = sample size from population 2
Interval Estimate of 1 - 2:Large-Sample Case (n1> 30 and n2> 30) • Interval Estimate with 1 and 2 Known where 1 - is the confidence coefficient • Interval Estimate with 1 and 2 Unknown where
Example: Par, Inc. Par, Inc. is a manufacturer of golf equipment. Par has developed a new golf ball that has been designed to provide “extra distance.” In a test of driving distance using a mechanical driving device, a sample of Par golf balls was compared with a sample of golf balls made by Rap, Ltd., a competitor. The sample data is below. Sample #1 Sample #2 Par, Inc.Rap, Ltd. Sample Sizen1 = 120 balls n2 = 80 balls Mean = 235 yards = 218 yards Standard Deviations1 = 15 yards s2 = 20 yards
Example: Par, Inc. • Point Estimate of the Difference Between Two Population Means 1 = mean distance for the population of Par, Inc. golf balls 2 = mean distance for the population of Rap, Ltd. golf balls Point estimate of 1 - 2 = = 235 - 218 = 17 yards.
Example: Par, Inc. • 95% Confidence Interval Estimate of the Difference Between Two Population Means: Large-Sample Case, 1 and 2 Unknown Substituting the sample standard deviations for the population standard deviation: = 17 + 5.14 or 11.86 yards to 22.14 yards. We are 95% confident that the difference between the mean driving distances of Par, Inc. balls and Rap, Ltd. balls lies in the interval of 11.86 to 22.14 yards.
Interval Estimate of 1 - 2:Small-Sample Case (n1 < 30 and/or n2 < 30) • Interval Estimate with 2 Known where • Interval Estimate with 2 Unknown where
Example: Specific Motors Specific Motors of Detroit has developed a new automobile known as the M car. 12 M cars and 8 J cars (from Japan) were road tested to compare miles-per- gallon (mpg) performance. The sample data is below. Sample #1 Sample #2 M CarsJ Cars Sample Sizen1 = 12 cars n2 = 8 cars Mean = 29.8 mpg = 27.3 mpg Standard Deviations1 = 2.56 mpg s2 = 1.81 mpg
Example: Specific Motors • Point Estimate of the Difference Between Two Population Means 1 = mean miles-per-gallon for the population of M cars 2 = mean miles-per-gallon for the population of J cars Point estimate of 1 - 2 = = 29.8 - 27.3 = 2.5 mpg.
Example: Specific Motors • 95% Confidence Interval Estimate of the Difference Between Two Population Means: Small-Sample Case For the small-sample case we will make the following assumption. 1. The miles per gallon rating must be normally distributed for both the M car and the J car. 2. The variance in the miles per gallon rating must be the same for both the M car and the J car. Using the t distribution with n1 + n2 - 2 = 18 degrees of freedom, the appropriate t value is t.025 = 2.101. We will use a weighted average of the two sample variances as the pooled estimator of 2.
Example: Specific Motors • 95% Confidence Interval Estimate of the Difference Between Two Population Means: Small-Sample Case = 2.5 + 2.2 or .3 to 4.7 miles per gallon. We are 95% confident that the difference between the mean mpg ratings of the two car types is from .3 to 4.7 mpg (with the M car having the higher mpg).
Hypothesis Tests About the DifferenceBetween the Means of Two Populations: Independent Samples • Hypothesis Forms: H0: 1 - 2< 0 H0: 1 - 2> 0 H0: 1 - 2 = 0 Ha: 1 - 2 > 0 Ha: 1 - 2 < 0 Ha: 1 - 2 0 • Test Statistic: • Large-Sample Case • Small-Sample Case
Example: Par, Inc. Par, Inc. is a manufacturer of golf equipment. Par has developed a new golf ball that has been designed to provide “extra distance.” In a test of driving distance using a mechanical driving device, a sample of Par golf balls was compared with a sample of golf balls made by Rap, Ltd., a competitor. The sample data is below. Sample #1 Sample #2 Par, Inc.Rap, Ltd. Sample Sizen1 = 120 balls n2 = 80 balls Mean = 235 yards = 218 yards Standard Deviations1 = 15 yards s2 = 20 yards
Example: Par, Inc. • Hypothesis Tests About the Difference Between the Means of Two Populations: Large-Sample Case Can we conclude, using a .01 level of significance, that the mean driving distance of Par, Inc. golf balls is greater than the mean driving distance of Rap, Ltd. golf balls? 1 = mean distance for the population of Par, Inc. golf balls 2 = mean distance for the population of Rap, Ltd. golf balls Hypotheses: H0: 1 - 2< 0 Ha: 1 - 2 > 0
Example: Par, Inc. • Hypothesis Tests About the Difference Between the Means of Two Populations: Large-Sample Case Rejection Rule: Reject H0 if z > 2.33 Conclusion: Reject H0. We are at least 99% confident that the mean driving distance of Par, Inc. golf balls is greater than the mean driving distance of Rap, Ltd. golf balls.