Download
1 / 31
310 likes | 477 Views
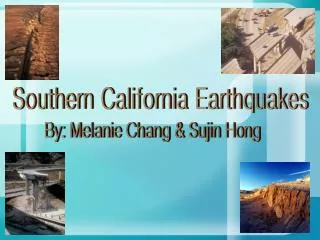
Low-Density Urbanization and Southern California Critical Habitats. Steven Guerry UP206a Final Project Winter 2011. Planning Issue. With respect to Southern California habitats critical to the survival of threatened and endangered species, where is it most urgent to set limits on growth?.

E N D
Low-Density Urbanization and Southern California Critical Habitats Steven Guerry UP206a Final Project Winter 2011
Planning Issue With respect to Southern California habitats critical to the survival of threatened and endangered species, where is it most urgent to set limits on growth?
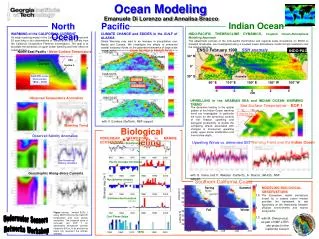
Introduction to Region of Analysis General Trends
County Populations (2008) Total Population: 22,423,000
Density (Pop./Sq. Mi.) Region Density: 397
Projected Population Growth 2010-2015 Regional Average: 5.99% While population is greatest on the coast, the largest projected growth rates are more inland.
Population Density & Total Population • Neither reveal the full impact of low-density development • Density shows no impact near critical habitats • Population shows no pattern at all
Why focus on low-density residential buildings? • Low-density housing by definition requires more land • Attracts low-density commercial development • Developed with the automobile in mind, low-density residential housing requires land-intensive automobile infrastructure like roads and parking • Recent trends suggest people are moving to rural areas to live in low-density housing • Low-density rural home development is the fastest-growing form of land use in the United States since 1950.* • Residential development poses a significant threat to native biodiversity • Many native species have reduced survival and reproduction near homes* • Exurban development has a large potential to alter biodiversity* * http://www.esajournals.org/doi/full/10.1890/05-5221
Mapping Definitions and Metrics • Urbanization and Growth (Source: U.S. Census Bureau) • Areas categorized as “urbanized” in 2000 • Population Density in 2000 • Projected Total Population Growth for 2010 and 2015 • Low-Density (Source: U.S. Census Bureau) • Percentage of housing composed of detached single-unit structures will serve as a proxy of overall low-density development. • Critical Habitats (U.S. Department of Fish and Wildlife) • Areas the Endangered Species Act deems “(I) essential to the conservation of the species and (II) which may require special management considerations or protection” for species classified as “Endangered” or “Threatened”.
Aggregate #1 Purpose To show where low-density development is most intense Method Percentage of housing categorized as “occupied structure with 1-unit detached” Total Population of Census Tract multipliedby
Aggregate #2: Projecting Growth • Purpose • Show where the greatest level of low-density development is expected. Methodology • Based on Census estimates for 2010 and 2015 Percent Increase of “occupied structure with 1-unit detached” Total Population Increase multipliedby • Exclusion: Census tracts that underwent (a) negative population growth AND(b) percentage of low-density housing decreased
Isolate the Areas of Low-Density Growth in Existing Urbanized Areas
Areas of Growth within 1-mile of Critical Habitats Over-layed on Urbanized Areas
Where is it most urgent to set limits on growth? 1. Within 1 mile of a critical habitat 2. Designated as urbanized by 2000 Census 3. Exhibits greatest trend of land intensive (low-density) growth Why limit growth and not just promote density? * http://www.esajournals.org/doi/full/10.1890/05-5221
Case Study: Hemet
GIS Skills • Inset • Aggregating attribute fields • Attribute sub-selections • Urban areas map was created by selecting areas classified as “urban” (U) from a map featuring both urban and rural areas. • Boundary sub-set selections • Urban areas map further trimmed to only include urbanization within five miles of critical habitats. • Distance • Buffering • Extracting Information from a buffer • Geoprocessing • Dissolved all Census Tracts in CA into a 10-county “Southern California” region • Upper two quantiles from aggregate #2 clipped by urban areas • Charts • Elevation • Google Mash-up