Download
1 / 9
90 likes | 163 Views
The last six slides contain the data for six groups (therefore, six trials). DO ALL WORK ELECTRONICALLY USING EXCEL. What you need to do is: Correct for the pressure/temperature fluctuations and thereby

E N D
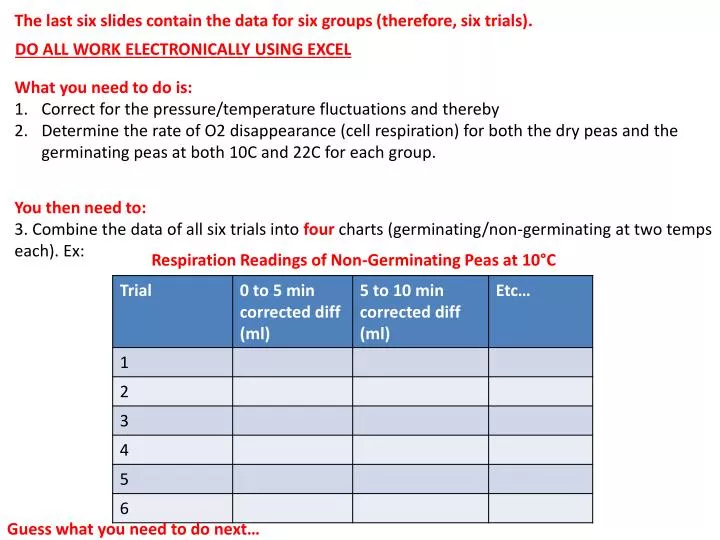
The last six slides contain the data for six groups (therefore, six trials). DO ALL WORK ELECTRONICALLY USING EXCEL What you need to do is: Correct for the pressure/temperature fluctuations and thereby Determine the rate of O2 disappearance (cell respiration) for both the dry peas and the germinating peas at both 10C and 22C for each group. You then need to: 3. Combine the data of all six trials into four charts (germinating/non-germinating at two temps each). Ex: Respiration Readings of Non-Germinating Peas at 10°C Guess what you need to do next…
4. Calculate a mean, SD and SE for each time interval. Where there is a mean, there is an SD/SE: Respiration Readings of Non-Germinating Peas at 10°C Now what to do with all of this data….hmmmm…
5. Make it easier to read…graphical display (graph it). What kind of graph? This one calls for an X-Y scatter plot…time goes on the x-axis, of course, and change in volume on the y. Change in volume (ml) Time (min) DO NOT FORGET TO PUT STANDARD ERROR BARS ON EACH TIME POINT!!! 6. Answer all the questions in the old AP lab as well as the new one within the excel file. Edmodo the file to DrT by the deadline (see calendar).
Group 1 Data (I filled in the 10C data as an example…you are welcome) 0.90 ml 0.90 ml 0.90 ml 0.81 ml 0.87 ml 0.04 0.09 0.01 0.06 0.86 ml 0.03 10 0.17 0.05 0.73 ml 0.84 ml 0.07 0.02 0.12 0.83 ml 0.67 ml 0.84 ml 0.09 0.04 0.18 0.23 0.05 0.81 ml 0.59 ml 0.82 ml 0.13 0.31 0.08 0.05 0.23 0.77 ml 0.90 ml 0.84 ml 0.92 ml 0.87 ml 0.82 ml 0.80 ml 0.84 ml 22 0.82 ml 0.69 ml 0.84 ml 0.82 ml 0.60 ml 0.82 ml 0.81 ml 0.48 ml In the actual lab manual, the chart has errors. This is how is should appear.
Group 2 Data 0.82 ml 0.86 ml 0.88 ml 0.76 ml 0.84 ml 0.86 ml 10 0.68 ml 0.81 ml 0.82 ml 0.66 ml 0.81 ml 0.82 ml 0.60 ml 0.81 ml 0.81 ml 0.75 ml 0.87 ml 0.88 ml 0.69 ml 0.82 ml 0.72 ml 0.63 ml 22 0.77 ml 0.57 ml 0.60 ml 0.78 ml 0.47 ml 0.60 ml 0.80 ml 0.37 ml In the actual lab manual, the chart has errors. This is how is should appear.
Group 3 Data 0.77 ml 0.90 ml 0.90 ml 0.70 ml 0.87 ml 0.86 ml 10 0.64 ml 0.84 ml 0.82 ml 0.59 ml 0.84 ml 0.81 ml 0.55 ml 0.82 ml 0.77 ml 0.75 ml 0.84 ml 0.86 ml 0.71 ml 0.82 ml 0.74 ml 0.70 ml 22 0.82 ml 0.63 ml 0.69 ml 0.82 ml 0.51 ml 0.67 ml 0.81 ml 0.40 ml In the actual lab manual, the chart has errors. This is how is should appear.
Group 4 Data 0.82 ml 0.86 ml 0.88 ml 0.77 ml 0.84 ml 0.86 ml 10 0.74 ml 0.81 ml 0.84 ml 0.70 ml 0.81 ml 0.82 ml 0.67 ml 0.81 ml 0.82 ml 0.84 ml 0.87 ml 0.92 ml 0.78 ml 0.82 ml 0.78 ml 0.71 ml 22 0.77 ml 0.62 ml 0.70 ml 0.78 ml 0.52 ml 0.70 ml 0.80 ml 0.38 ml In the actual lab manual, the chart has errors. This is how is should appear.
Group 5 Data 0.79 ml 0.90 ml 0.90 ml 0.75 ml 0.87 ml 0.86 ml 10 0.71 ml 0.84 ml 0.84 ml 0.70 ml 0.84 ml 0.82 ml 0.66 ml 0.82 ml 0.79 ml 0.88 ml 0.84 ml 0.89 ml 0.84 ml 0.82 ml 0.79 ml 0.84 ml 22 0.82 ml 0.68 ml 0.83 ml 0.82 ml 0.57 ml 0.81 ml 0.81 ml 0.48 ml In the actual lab manual, the chart has errors. This is how is should appear.
Group 6 Data 0.78 ml 0.86 ml 0.90 ml 0.72 ml 0.84 ml 0.88 ml 10 0.65 ml 0.81 ml 0.84 ml 0.60 ml 0.81 ml 0.84 ml 0.56 ml 0.81 ml 0.81 ml 0.90 ml 0.87 ml 0.97 ml 0.84 ml 0.82 ml 0.80 ml 0.77 ml 22 0.77 ml 0.63 ml 0.76 ml 0.78 ml 0.52 ml 0.76 ml 0.80 ml 0.40 ml In the actual lab manual, the chart has errors. This is how is should appear.