Download
1 / 27
270 likes | 284 Views
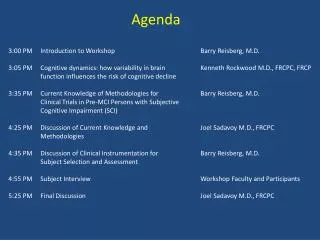
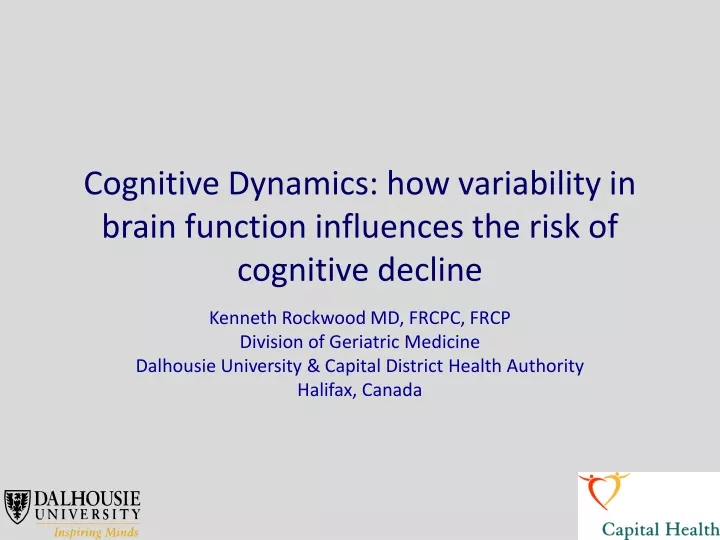
Cognitive Dynamics: how variability in brain function influences the risk of cognitive decline. Kenneth Rockwood MD, FRCPC, FRCP Division of Geriatric Medicine Dalhousie University & Capital District Health Authority Halifax, Canada. Disclosure – in the last 5 years Kenneth Rockwood.

E N D
Cognitive Dynamics: how variability in brain function influences the risk of cognitive decline Kenneth Rockwood MD, FRCPC, FRCP Division of Geriatric Medicine Dalhousie University & Capital District Health Authority Halifax, Canada
Disclosure – in the last 5 years Kenneth Rockwood Personal proprietary interests: I am President and Chief Scientific Officer of & a shareholder in DementiaGuide Inc., a web-based, spin-off company with contracts with governments and the pharmaceutical and food products industries (Danone, GSK, JAI, Medevation, Pfizer, Shire) and public sponsorship through Innovacorp, Industry Canada, the National Research Council and the Atlantic Canada Opportunities Agency. Research sponsorship: My research is sponsored by peer-reviewed funding from the Canadian Institutes of Health Research. Alzheimer Society of Canada. National Natural Science Foundation of China. Mathematics of Information Technology and Computer Science of the Science Council of Canada, the Atlantic Regional Data Centre of Statistics Canada, the Fountain Fund of the Queen Elizabeth II Health Sciences Foundation and the Dalhousie Medical Research Foundation. Lobbying: I am a member of the Canadian Dementia action Network, a consortium of scientists lobbying the federal government for more research funding for dementia. Personal links with pharma: In 2010, I attended a meeting as a consultant to Glaxo SmithKline. In 2010, I was sponsored as a speaker at the ICAD meeting in Hawaii by Bristol Myers Squib. In 2010, I acted as an expert witness for Pfizer Canada in a lawsuit on patent protection of donepezil in Canada. In 2008, I attended an advisory board meeting in London, England, for GSK, and one in Quebec City for Janssen Ortho Canada. In 2007, I spoke at a CME meeting in Truro, Nova Scotia, sponsored by Novartis Canada.
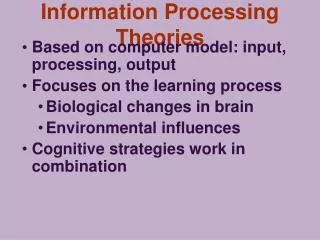
Statement of the problem • Many older people have subjective complaints about their cognition (memory, thinking language) even though there is not much we can demonstrate is wrong by objective testing. • Whether these complaints result in an increased risk is unclear, even though it does go with increased risk in some groups (e.g. memory clinic patients). • These complaints fluctuate, but whether fluctuation is a signal or just noise is disputed. The consensus now favours that it is just noise.
Objectives • To describe the idea of “cognitive dynamics” – how brain function can fluctuate, especially in situations where the brain must “fight back”. • To consider how fluctuation needs to be considered an opportunity to understand anti-dementia drugs, and not as noise in testing them.
Why this problem is important Subjective complaints might be important because they might represent an increased risk of dementia. Fluctuation is important because it can obscure this risk – making it look bigger or smaller than it actually is.
What is needed We need to understand how fluctuation works. Today we will examine: - what fluctuation is - how it impacts on how we measure interventions (drugs, exercise) that could reduce risk.
Variability Biological variability: meaningful trivial Measurement error: impression inaccuracy
Typically, variability is seen as “noise” “Neuropsychological clinical decision-making is complicated by the fact that variability in test performance increases with advancing age.” Eur J Neurol. 1999 Nov;6(6):645-52.
Cognitive dynamics Everyday experience suggests fluctuation in levels of cognition (memory, thinking, word finding), mood, flu, headache, alcohol use, sleep, stress, season.
The most common cartoon model of how MCI and AD work. +++++++++++++++++ MCI Cognitive function AD Time
Variability as (chiefly) non-linearity, Cognitive function Time
Is variability unrelated to disease progression? Cognitive function Time
Does variability decrease with disease progression? Cognitive function Time
Does variability increase with disease progression? Cognitive function Time
0.3 0.3 0.3 0.3 0.2 n=0 3ms=99-100 0.2 n=1 3ms=97-98 0.2 n=2 3ms=95-96 0.2 n=3 3ms=93-94 0.1 0.1 0.1 0.1 0 0 0 0 0 10 0 10 0 10 0 10 n=4 3ms=91-92 n=5 3ms=89-90 n=6 3ms=87-88 n=7 3ms=85-86 The probability of transitions 0.2 0.2 0.2 0.2 0.1 0.1 0.1 0.1 0 0 0 0 0 10 0 10 0 10 0 10 n=9 3ms=81-82 n=8 3ms=83-84 n=10 3ms=79-80 n=11 3ms=77-78 0.2 0.2 0.2 0.2 0.1 0.1 0.1 0.1 0 0 0 0 0 10 0 10 0 10 0 10 State-number Cognitive transitions (3MS) show a pattern similar to other ageing processes where dynamics can be modeled
Average number of deficits given zero deficits at baseline 0.2 0 0 5 10 The difference between the average number of deficits at the two incremental deficit numbers at baseline 0.4 0.2 0 0 10 The intercept and the slope in the probability of death as a function of the number of deficits at baseline n 0 10 Four parameters of the model and their Interpretation
Loss of redundancy in relation to deficit accumulation in a Frailty Index based on Comprehensive Geriatric Assessment 0 Log of the Frailty Index -0.5 -1 -1.5 -2 -2.5 -3 70 75 80 85 90 95 100 Age, years Rockwood, Rockwood, Mitnitski., J Am Geriatrics Soc, 2010;58:318-323
What dynamic biological variability looks like • In mild AD – possibly variability in psychomotor speed, fMRI resting rate, EEG parameters. • In moderate – severe AD: good days and bad days?
The default neural networks at resting state may be altered with the development of AD Mild AD patients Healthy older adults
Variability in psychomotor speed in older adults Table 1. Descriptive statistics Mean Standard deviation Minimum Maximum . . . . . . . . . . . . . . . . . . . . . . . . . . . . . . . . . . . . . . . . . . . . . . . . . . . . . . . . . . . . . . . . . . . . . . . . . . . . . . . . . . . . . . . . . . . . . . . . . . . . . . . . . . . . . . . . . . . . . . . . . . . . . Age 73.2 8.1 60 93 Height (cm) 167.6 11.2 154.9 188.0 Weight (kg) 77.7 15.5 58.6 114.5 Functional fitness scores Ponderal index 12.0 0.6 10.4 13.1 Flexibility (inches) 23.9 4.2 13.0 34.0 Agility/balance (s) 29.5 8.1 17.2 57.0 Coordination (s) 12.2 2.8 9.9 26.0 Muscle strength and end (repetitions) 21.2 6.5 13.0 38.0 Cardiovascular endurance (s) 526.3 77.0 384.7 737.0 Heart rate variability RR interval (ms) 873.9 122.4 719.0 1196.2 SDNN (ms) 33.1 14.9 11.4 70.8 LF power (nu) 32* 19 18 74 HF power (nu) 68* 19 26 82 LF/HF ratio 0.5* 0.9 0.2 2.9 _________________________________________________________________________________________________________________________ * Median Score Age and Ageing 2003; 32 : 415–421
Neurocompensation People with higher perceptual speed and performed better [on testing] despite the burden of tangles. Perceptual speed also attenuated the associations of amyloid with cognitive test scores. Reference: Boyle et al., Processing resources reduce the effect of Alzheimer pathology on other cognitive systems. Neurology. 2008;70:1534-42
Absolute variability Variance Standard deviation Standard error of the mean Relative variability Coefficient of variation Variability – absolute vs. relative
Absolute variability in ageing measures increases with age (A), but relative variability decreases (B). A 1.5 1.5 1.5 1.5 B B B B 1.4 1.4 1.4 1.4 1.3 1.3 1.3 1.3 men 1.2 1.2 1.2 1.2 1.1 1.1 1.1 1.1 Coefficient of variation women 1 1 1 1 0.9 0.9 0.9 0.9 0.8 0.8 0.8 0.8 0.7 0.7 0.7 0.7 0.6 0.6 0.6 0.6 20 30 40 50 60 70 80 90 20 20 20 30 30 30 40 40 40 50 50 50 60 60 60 70 70 70 80 80 80 90 90 90 Age (years) The distribution (histogram) changes from very skewed at 45-50 years to more symmetrical at old ages • Rockwood & Mitnitski, Mech Ageing Dev, 2004;125:517-9.
Variability measurement remedies Measure variability – e.g. multiple measures of psychomotor speed and its fMRI / EEG correlates. Measure symptoms (role of the web) Look for stable time frames. Measure more things rather than fewer things.
Summary – the Gretzky principle • Skate to where the puck will be. • Bring the right talent, and the right gear.
Acknowledgments Funding sources: Fountain Innovation Fund of the QEII Health Sciences Foundation Canadian Institutes of Health Research Mathematics of Information Technology and Computer Science program, National Research Council Alzheimer Society of Canada Dalhousie Medical Research Foundation Colleagues & students: Arnold Mitnitski Nadar Fallah Xiaowei Song Ruth Hubbard Melissa Andrew Michael Rockwood Samuel Searle Paige Moorhouse, Laurie Mallery & “PATH”