Download
1 / 20
210 likes | 458 Views
WATER SCARCITY MANAGEMENT. by Özden BİLEN. 1. WHAT IS WATER SCARCITY ? Some conceptual issues. Scarcity : Excess of demand over usable water or available water in a given region Water Availability : Annual average flow per head of population (Standard Hydrological Index, SHI)

E N D
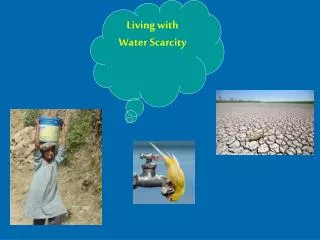
WATER SCARCITY MANAGEMENT by Özden BİLEN
1. WHAT IS WATER SCARCITY ? Some conceptual issues • Scarcity : Excess of demand over usable water or available water in a given region • Water Availability : Annual average flow per head of population (Standard Hydrological Index, SHI) OR The number of people dependent on given amount of water (e.g. 1000 m3/caput = one million people reliant of one billion m3) • Some problems defining and quantifying SHI : (i) e.g SHI(1) = 185 km3/67.3 million = 2700 m3/caput SHI(2) = 95 km3/67.3 million = 1400 m3/caput (ii) SHI does not include underground water (iii) SHI masks extreme local variabilities or
(iv) Scarcity is partly a social and economic construct and it is difficult to capture in a single quantitative index • Water scarcity is influenced by social, institutional, policy factors, lifestyle, water quality etc. • Social & economic problems might feed back to water scarcity problems, • A country having better social adaptive capacity may be better off than a similar water scarce country as measured by SHI. Ohlson suggests that an index for “Social Water Scarcity, SWS” could be constructed through dividing SHI by the Human Development Index (HDI) (according to the UNDP’s human development report ,1997, HDI changes in between 0.176 - 0.960) • SHI for water availability has some a.m. drawbacks. However, because of its virtue of simplicity, it is being used as an “early warning indicator”. Yet a resource analysist should be aware all these points for assessing and interpretation of water scarcity issues. • In order to make comparison among countries or regions using ‘SHI’, attempts have been made to define a threshold under which a country may be considered in a situation of water shortage. The limit of 1000 cubic meters per person is often quoted as representing a condition of severe water shortage
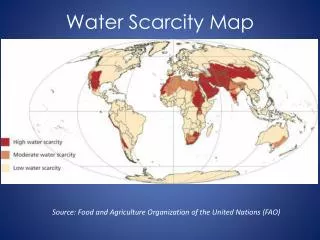
2. THE WORLD FRESH WATER SUPPLY/ WATER USES AND TRENDS • SUPPLY • Hydrological cycle • Supply by rain on land 110 000 km3 • Evaporation and transpiration - 70 000 km3 • Net effect of hydrological cycle 40 000 km3 • Much of 40 000 km3 flows into the sea as floods, since flow rate is too large to capture, it is held in soil and swamps, etc. • Excluding flood flows, baseflow(stable-runoff) is about 9 000-14 000 km3. • Uneven global distribution is striking. E.g. the Amazon River accounts for 20% of global average and the Zaire River basin accounts for 30% of Africa’s total runoff. • TABLE 1 shows global water distribution by region and per capita 1 km3 = 1 billion(milyard) m3
In MENA countries ; Yemen 176 m3, West Bank & Gazza 105 m3, Jordan 213 m3, Israel 375 m3 per capita • China’s situation is particularly important, since that country with approximately one-quarter of the World’s population can claim only 8 % of its freshwater resources . • In Africa, Kenya, Somalia, Rwanda, Etophia and some Sub-Saharan countries are water scarce. Other countries with pronounced rainfall variability include Turkey, Pakistan, India (Western and Southern India), parts of Mexico. Global averages only tell us that this is a widely shared problem, there are huge local and temporal variations.
Water Use / Trends Figure 1 indicates that global annual abstractions of water out of natural system of rivers and lakes was about 1360 km³/year in 1950 and will be estimated as about 5000 km³/year in 2000 (Abernethy, 1996). In other words, global water abstractions during the period 1950-2000 increased by more than three- fold. In 1950 we were abstracting some 10-15 percent of the abstractable total; now we take perhaps 35-50 %, and if present rate of increase continue we can expect to reach the ceiling (in terms of global averages) in some 30-50 years from now. Currently 70% of the World’s cultivated land is watered exclusively by rainfall and half of World’s food comes from rainfed agriculture. However, Figure 1 does not include agricultural uses under “rainfed” conditions. Source: Abernety (1996, quoted from Meybeck, Chapman and Helmer) Figure 1: Annual global abstraction of water from the natural system for human use
http://www.unesco.org/science/waterday2000/water_use_in_the_world.htmhttp://www.unesco.org/science/waterday2000/water_use_in_the_world.htm
Source : I.A. Shiklomanov, 1990. Global Water Resources Nat. Resour., 26: 34-43 Note: Consumption by reservoirs is through evaporation Figure 2 : World Water Consumption According to Use According to the Figure 2, agriculture’s share in overall global consumption was 85 percent in 1950 and dropped to an estimated 68 percent in 2000 (as global averages). During the same period industrial consumption had grown to 25 percent, while consumption by cities increased from 2 percent to nearly 9 percent. The 21st century will be characterized by increased urbanization. By 2025, 60 % of the World population more than 5 billion people will be living in cities. Many countries will be unable to fund both economic growth and adequate social and physical infrastructure for uncontrolled influx of people to the cities. Some 90 % of waste water generated in the large urban centers is discharged without any treatment (Butt, 1997).
Table 2 says that the big users are not the developing countries but the richer industrial countries of the temperate zones. On average, Africans only about a quarter of what North Americans use for agricultural purposes, and 3 % of which North Americans use for other purposes. Even in Asia, where about 70 % of world’s irrigated land is, quite moderate amounts of water for agriculture is being used. Although water is abundant in Africa, poverty has a tremendous impact on African water resources. Africa has not developed irrigation to the same extent as other developing areas, particularly in Asia. For example, India, which has only about one-tenth the surface of Africa, irrigates five times as much land (Kandiah, 1988). Table 3 suggests that as countries become richer, their consumption of water for agriculture increase relatively little, but non agriculture uses grow enormously. Water use patterns differ between industrialized and developing countries. In the industrial countries, industrial-uses account for about 50 %, while in developing countries industries use no more than 20 %.
SUFFICIENT WATER RESOURCES + LOW POPULATION DENSITY ? WATER SCARCITY In some cases, there is no relation between per capita water availability and consumption This analysis shows us that water can be scarce in different ways. There are two major sources of scarcity with different implications: • Water Scarcity due to Low Utilization • Water Scarcity due to High Population Density and/or Aridity
3. CAUSES OF WATER SCARCITY • Growth in population • Environmental degradation • Modification in land use pattern • Global climatic change • Pollution of water resources • Financial and institutional problems
Growth in Population • The United Nations publishes high, medium and low population projections. • Most people would agree that high projection can be ignored, • According to medium projection : 7.8 billion in 2025 continue to grow indefinitely, • According to low projection : 7.3 billion in 2025 cease to grow around 2040 at a level of 7.5 billion people • Doubling time of World population is about four decades with compound rate of 1.7% per year (USA 114 years, Egypt 31 years, India 37 years, Iran 24 years, Iraq 19 years, China 66 years, Mexico 32 years (Butts, 1997), Turkey 44 years with compound rate of 1.6% per year) • Classical Malthusian Discourse vs. Virtual Water Discourse • Demographic Race between Countries
Environmental Degradation • Modification in Land Use Pattern • Land use pattern may reduce the amount of surface water • People are forced to use marginal lands • Forests are cleared so that land can be used as agricultural purposes • Reduction in dams’ storage capacity • Poverty feeds back to environmental problems • Global Climatic Change • Permanent increase of CO2 • Target values for greenhouse emissions reduction below 1990 levels by 2012 (the EU %8, the USA %7, Japan %6 etc.)
CO2 emission by region and per capita is shown in Figure 3 : • Poor countries argue that they can not afford to put the brakes on their own domestic industrialization • Global warming may be irreversible • Policy approaches for ‘adopting’ or ‘mitigating’ to global warming
Pollution of Water Resources • Water scarcity is not only a problem of the amount of water availability but increasingly as well a problem of water quality • 1.2 billion people do not have access to safe drinking water and 2.9 billion lack to adequate sanitation facility Source : World Water Vision (1999) Figure 4 : Number of People without Safe Drinking Water Source : World Water Vision (1999) Figure 5 : Number of People without Adequate Sanita
4. WATER SCARCITY MANAGEMENT • To manage water scarcity, solutions could be divided into two broad categories : • Supply-side Measures • Demand-side Measures
Supply-side Measures Renewable freshwater resources is to be utilized to the limits of sustainable yields by dams, wells for groundwater exploitation, inter-basin water transfers, etc. 37 000 large dams were constructed in 20th Century, irrigated area increased from 74 million hectares in 1950 to 274 million hectares at the end of 20th century. In some water scarce regions, e.g. ME, seawater desalination, sewage reclamation seems environmentally economic solutions.
Only physical facilities failed to respond the needs of growing population. And these measures should be complemented with Demand-side Measures
Demand-side Measures More efficient use of existing supplies. Dublin Principles of 1992 : Water has an economic value in all its competing uses and should be recognized as an economic good. Water pricing is an important element for sectoral allocation of water.
5. RECOMMENDATIONS • Many countries confront the prospect of emerging water scarcity in the long term and for some that spectre is already on them because of decrease in the supply of water resource, increase in demand or unequal resource distribution. • It is therefore recommended to define and implement a comprehensive and integrated framework for decision-making on water scarcity management. Among the multitude of decisions to be taken, two critical phases have been identified : • Phase 1 : Water Resources and Demand Assessment - Development of key indicators, - Dynamic character of sectoral water demand, - Forecasting complemented by backcasting. • Phase 2 : Comprehensive Options Assessment - Focus on the methodology to be developed so that one can study on alternative choices in terms of prediction and management of increasingly scarce water resources, - Improving quality of decisions through Decision Support System, - Water politics are shifting from projects to policies and institutional development, - As a key element, institutional capacity building, - Assessing institutional capacity for implementation of selected options.