Download
1 / 29
290 likes | 489 Views
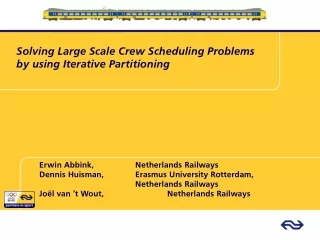
Reinventing Crew Scheduling. At Netherlands Railways. Erwin Abbink, NS Reizigers bv, The Netherlands (NL) Matteo Fischetti, University of Padua, Italy Double Click sas, Italy Leo Kroon, Erasmus University Rotterdam, NL NS Reizigers bv, NL

E N D
Reinventing Crew Scheduling At Netherlands Railways • Erwin Abbink, NS Reizigers bv, The Netherlands (NL) • Matteo Fischetti, University of Padua, Italy Double Click sas, Italy • Leo Kroon, Erasmus University Rotterdam, NL NS Reizigers bv, NL • Gerrit Timmer, Free University of Amsterdam, NL ORTEC International bv, NL • Michiel Vromans, Erasmus University Rotterdam, NL
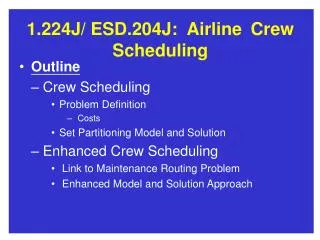
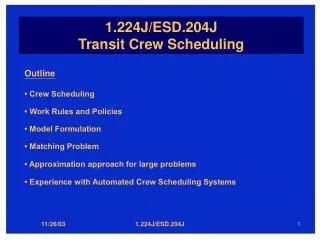
Contents • Introduction • History • Development of an alternative model • Sharing Sweet&Sour • TURNI and solution methods • Efficiency improvements • Conclusions
NS Reizigers (Netherlands Railways) • Main Dutch operator of passenger trains • 5,000 timetabled trains per weekday • 1 million passenger trips per weekday • 112 million train kilometers per year • 3,000+ drivers and 3,500+ conductors • 29 crew depots • 2,600+ carriages
0 50km NS Reizigers (Netherlands Railways) • 29 Depots • Duties are created in Utrecht (Ut) • Rosters are created • locally in the depots Ut • Focus: Duties
Crew management Efficiency Robustness Punctuality Find: - Balance - Trade-off Acceptance
Maximum duty length Duty examples Minimum transfer time Pre- and post times Meal break rule • - Route knowledge • Rolling stock knowledge
Rostering Rules Maximum percentage night duties Maximum average duty length Maximum percentage long duties (>9 hrs)
History • June 10th 2001: introduction of the “Church Circles” • Aim of the management (TOP DOWN): • Improve robustness / punctuality and service • How: • Less different trains / routes per duty • Train change only during meal break • Better knowledge of local situation
History • Drivers and conductors were quite unhappy • Decrease in quality / variation of their work • Unfair division of aggression work over depots • “Secret agenda of management” • Punctuality down • Motivation down / Sickness up
STRIKES STRIKES Involved parties Depot A Union A Management Works Council Union B Depot B
Involved parties Depot A Union A Management Works Council Union B Depot B
Development of alternative model Depot A Union A Management Works Council Union B Depot B
Alternative 1 Selection by Works Council ‘Sharing Sweet & Sour’ 2-day conferences . . . . Acceptance by Management Alternative n Hundreds of optimization runs with TURNI Participative approach (BOTTOM UP)
Sharing Sweet&Sour Additional variation rules: • Max Repetitions In Duties (RID) • Max percentage of aggression work per depot • Max standard deviation on aggression • Min percentage of preferred trains per depot • Max standard deviation on preferred trains • Min number of routes per depot • Min average number of routes • Max percentage of Rolling Stock cluster per depot
Sharing Sweet&Sour: variation statistics ---------------------------------------------------------- Crew | | RID |% Pref.|%Aggres| RS | Nasty RS Depot |Routes | Avg | Train | Train |Clust| (1) (2) ---------------------------------------------------------- Ah | 19 | 2.4 | 63.9 | 9.6 | 7 | 0.8 15.2 Amf | 22 | 2.4 | 46.0 | 29.5 | 6 | 29.7 25.3 Amr | 22 | 2.5 | 67.9 | 42.6 | 6 | 26.6 3.9 Asd | 40 | 2.5 | 58.0 | 29.9 | 6 | 36.4 8.9 Ddr | 13 | 2.6 | 35.0 | 24.9 | 4 | 15.9 46.6 Ehv | 17 | 2.6 | 38.5 | 4.1 | 6 | 0.3 58.7 Ekz | 23 | 2.9 | 28.9 | 27.4 | 6 | 32.0 8.8 Es | 16 | 2.7 | 47.9 | 6.7 | 6 | 0.0 6.1 . . . . . . . . . . . . . . . . . . . . . . . . Llso | 21 | 2.3 | 44.0 | 44.4 | 5 | 44.4 15.6 Mt | 11 | 2.7 | 42.3 | 2.0 | 3 | 0.0 54.6 Nm | 18 | 2.3 | 44.0 | 7.6 | 7 | 0.4 35.6 Rtd | 32 | 2.3 | 32.2 | 20.5 | 6 | 14.6 32.2 Ut | 44 | 2.5 | 27.1 | 14.6 | 6 | 8.6 51.8 Vl | 14 | 2.8 | 40.3 | 2.6 | 6 | 0.0 38.4 Vs | 17 | 2.5 | 64.1 | 15.3 | 4 | 8.3 26.4 Zl | 26 | 2.3 | 54.4 | 3.0 | 7 | 13.0 5.8 ---------------------------------------------------------- Global | 21.2 | 2.4 | 12.5 | 12.8 |
TURNI: crew scheduling system by Double Click sas • TURNI based on a set covering model with many additional nasty “depot” constraints • Typical instance of NS Reizigers (drivers): - 14,000 timetabled trips - 1,000 duties from 29 crew depots • Extensive customizations for NS Reizigers
(Extended) Set Covering model subject to
Solution techniques • Dynamic column generation • Column generation based on dynamic programming • Lagrangian optimization instead of LP • Fast heuristics using Lagrangian dual information • Intensification through variable fixing / local branching • Solution refinement through matching model
Railways vs. Airlines • Large instances in comparison with airlines: - more activities / legs per instance (14,000) - more activities / legs per duty / pairing (avg. 14) • Crew qualifications cannot be used to partition instances • More complex and detailed rules: - rolling stock circulation - complex variation rules - depot constraints
Real savings: $ 4.8 million as variation was larger than agreed • earlier in order to increase personnel acceptance $ 7 mill. $ 4.8 mill. Efficiency improvement 2003 - 2004 • Total amount of work: + 3.2% • Total # duties: + 1.2% • Initial savings: 2.0% $ 7 million • Generation of the duties • subject to the new rules • would have been impossible • without TURNI
Efficiency improvement 2005 • Reduction of the transfer time from 25 to 20 minutes (only a minor negative effect on robustness / punctuality) • Efficiency improvement of 2.5% or $8 million per year • Total savings: $7 + $8 = $15 million per year • Using TURNI, changing the duty structures is easy (both for analysis and for production planning)
Conclusions • Application of TURNI led to: - a new production model (Sharing Sweet&Sour) - more efficient duties (4.5%) • Unpunctuality decreased by 25% (Punctuality 80% → 85%) • Motivation of personnel up • Sickness rate down by 50% • BOTTOM UP > TOP DOWN
Conclusions • Initially nobody believed in the existence of a solution for the conflicts between all parties • Combination of a participative approach together with expertise in Operations Research led to the success • Operations Research led to quantitative and objective results accepted both by personnel and management
Conclusions Depot A Union A Management Works Council Union B Depot B
O O Conclusions Depot A Union A Management Works Council Union B Depot B
O -- Conclusions Depot A Union A Management Works Council Union B Depot B
O R Conclusions Depot A Union A Management Works Council Union B Depot B