Download
1 / 21
210 likes | 334 Views
Implementing the Renewable Portfolio Standard in California. Cynthia Walker Division Of Ratepayer Advocates November 3, 2011. About DRA.

E N D
Implementing the Renewable Portfolio Standard in California Cynthia Walker Division Of Ratepayer Advocates November 3, 2011
About DRA • The Division of Ratepayer Advocates (DRA) is an independent unit within the California Public Utilities Commission that represents consumers’ interests on utility matters. • Our statutory mission is to obtain the lowest possible rates for utility services consistent with safe and reliable service levels.
Overview of Presentation • Renewable Portfolio Standard • Background • Progress in Renewable Procurement • Costs • Renewable Energy Programs • Conclusions and Recommendations
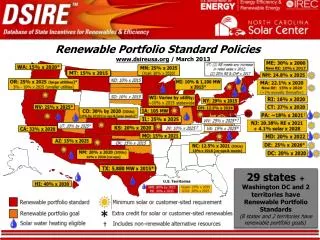
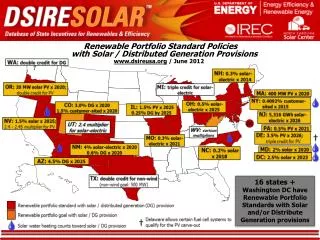
Legislation Establishing the Renewable Portfolio Standard (RPS) • SB1078 (Sher, 2002) required increasing renewables by 1% per year with a goal of achieving 20% by 2017 • SB 107 (Simitian, 2006) accelerated the RPS to 20% by 2010 with flexible compliance extending the deadline to 2013 • SB 1036 (Perata, 2007) adopted ratepayer protections through limits on total costs
SBx1 2 (Simitian 2011) established 33% RPS by 2020 • Long term goal of competitive & self sustaining supply of renewables • Requires reporting on total cost of program each year • No penalty if all reasonable action taken to achieve goal • Requires CPUC to establish a cost limitation for each IOU • Limits procurement to resources that can be procured without exceeding a de minimis increase in rates
CPUC Is Implementing The New Legislation • The CPUC has opened a new Rulemaking 11-05-005 to implement the new legislation • It aims to settle the main technical and definitional issues by the end of 2011 • The CPUC then intends to address the cost limitation mechanism • Finally, other policy issues with implementing the new 33% standard will be addressed in 2012
Risk Profile of Executed RPS Contracts All IOUs RPS Procurement Pipeline by number of milestones reached 80,000 No milestones achieved 1 milestone 70,000 achieved 2 milestones 60,000 achieved 3 milestones 50,000 achieved All milestones achieved GWh 40,000 33% RES 30,000 20% RPS 20,000 10,000 0 2010 2011 2012 2013 2014 2015 2016 2017 2018 2019 2020 Data from the August 2010 Compliance Reports and Project Development Status Reports (PDSRs) filed by PG&E, SCE, and SDG&E.
Challenges with Implementing RPS • Renewable development encounters a number of difficulties and delays in California including: permitting, transmission, and financing • The state has multiple and overlapping policy goals at the initiative of both the Legislature and the CPUC • Multiple goals and mandates can increase demand for renewables and costs to ratepayers • Not all costs are accounted for in design and approval of renewable programs
Rate Impacts • Renewable energy costs and prices are generally higher than conventional generation • A substantial portion of each utility’s RPS portfolio has not yet come online and, subsequently, has not yet entered rates • Utilities are predicting that rates will increase in the future although it is not clear how much of that increase is due to renewables
Utility Costs • Transmission & distribution upgrades • Integration costs [1] AB 67 Report, April 2011, p. 7.
IOU Share of contracts above applicable MPR Average applicable MPR (Levelized $/MWh post-TOD) PG&E 77% $123.46 SCE 41% $92.27 SDGE 47% $100.57 All 59% $104.08 Findings from Green Rush Report: Renewable Contracts Above MPR
AMFs to 2010 for RPS-eligible Contracts Data from August 2010 AMF Calculators. Figures in nominal dollars.
Multiple Programs Created to Implement RPS Goal • Solicitations for Contracts • Bilaterally Negotiated Contracts • Tradable Renewable Energy Credits (TRECs) • Qualifying Facilities (QFs) • Renewable Auction Mechanism (RAM) • Qualifying Facilities (QFs) • Renewable Auction Mechanism (RAM) • Feed-in-Tariff (FIT) • Solar Photovoltaic Program • Utility-Owned Generation (UOG)
Other Programs Support RPS • California Solar Initiative (CSI) • New Solar Homes Partnership (NSHP) • Net Energy Metering (NEM) • Small Generator Incentive Program (SGIP) • Emerging Renewables Program (ERP)
Some Renewable Program Costs Qualifying Facilities: $20.7 billion to be expended on renewable QFs 2003 to 2020 Solicited RPS contracts: an estimated $20.8 billion to be expended 2003 to 2020 Bilateral RPS contracts: an estimated $13.3 billion to be expended 2003 to 2020 California Solar Initiative: $2.1 billion budgeted for the program Net Energy Metering: annual expenditures are expected to be approximately $500,000 New Solar Homes Partnership: $400 million budgeted for the program
Conclusions • The 20% renewable goal will be achieved by 2013 • The IOUs are on track to reach the 33% goal by 2020 • There are multiple programs designed to increase the amount of renewable energy developed • Past attempts to establish cost limitations have not been successful • The cost of achieving RPS goals are not yet in customer rates • Customer rates are expected to increase due to renewables and other utility expenditures
Recommendations • CPUC work with stakeholders to determine ways to reduce time for project implementation • Policy makers weigh in earlier on projects • CPUC should reject projects that are not competitive • CA needs to coordinate various policy and implementation goals for climate change
Contact Information Cynthia Walker CIW@cpuc.ca.gov