Download
1 / 12
130 likes | 159 Views
Learn to recognize and graph periodic trigonometric functions with amplitude, phase shift, and more. Understand how translations affect sine and cosine graphs in Holt McDougal Algebra 2. Explore phase shifts, vertical shifts, and periods in sine and cosine functions through key transformations. Practice drawing function graphs with translations, reflections, and understanding amplitude and period. Combine transformations using key values to identify important features of trigonometric functions. Master the translation of graphs up, down, left, and right in trigonometry lessons. Improve your understanding of trigonometric functions through visual representations.

E N D
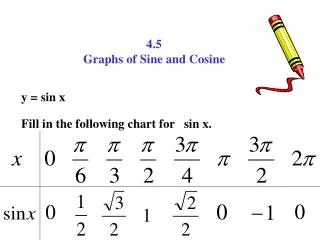
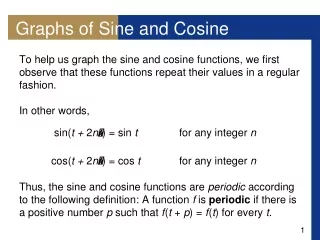
Graphs of Sine and Cosine Essential Questions • How do we recognize and graph periodic and trigonometric functions? Holt McDougal Algebra 2 Holt Algebra 2
Translations of Trigonometric Graphs Translation of a Sine Function Amplitude Period
Translations of Trigonometric Graphs Translation of a Sine Function Amplitude Period Moving a graph left or right is called a phase shift.
Amplitude Phase shift Vertical shift Period You can combine the transformations of trigonometric functions. Use the values of a, b, h, andkto identify the important features of a sine or cosine function. y =asinb(x–h)+k
Translations of Trigonometric Graphs Draw one cycle of the function’s graph. Amplitude Period Translation down 2
Translations of Trigonometric Graphs Draw one cycle of the function’s graph. Amplitude Period Translation up 3
Translations of Trigonometric Graphs Draw one cycle of the function’s graph. Amplitude Period Translation right p
Translations of Trigonometric Graphs Draw one cycle of the function’s graph. Amplitude Period Translation left p
Translations of Trigonometric Graphs Draw one cycle of the function’s graph. Amplitude Period Translation right p/2
Translations of Trigonometric Graphs Draw one cycle of the function’s graph. Amplitude Period Reflection over x-axis
Translations of Trigonometric Graphs Draw one cycle of the function’s graph. Amplitude Period Reflection over x-axis