Download
1 / 69
700 likes | 1.14k Views
Simple Linear Regression (SLR) CHE1147 Saed Sayad University of Toronto. Types of Correlation. Positive correlation. Negative correlation. No correlation. Simple linear regression describes the linear relationship between a predictor variable, plotted on the x -axis, and a

E N D
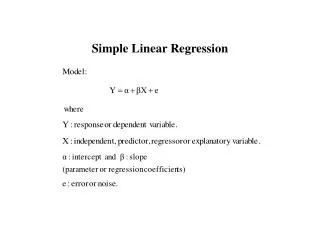
Simple Linear Regression (SLR) CHE1147 Saed Sayad University of Toronto
Types of Correlation Positive correlation Negative correlation No correlation
Simple linear regression describes the linear relationship between a predictor variable, plotted on the x-axis, and a response variable, plotted on the y-axis dependent Variable (Y) Independent Variable (X)
Y 1.0 X
Y 1.0 X
Y X
ε Y ε X
Fitting data to a linear model intercept slope residuals
How to fit data to a linear model? The Ordinary Least Square Method (OLS)
Least Squares Regression Model line: Residual (ε) = Sum of squares of residuals = • we must find values of and that minimise
Variance to be explained by predictors (SST) Y
X1 Variance explained byX1 (SSR) Y Variance NOT explained byX1 (SSE)
Regression Statistics Coefficient of Determination to judge the adequacy of the regression model
Regression Statistics Correlation measures the strength of the linear association between two variables.
Regression Statistics Standard Error for the regression model
ANOVA ANOVA to test significance of regression
Confidence Interval on Regression Coefficients Confidence Interval for b1
Confidence Interval on Regression Coefficients Confidence Interval for the intercept
Hypotheses Test the Correlation Coefficient We would reject the null hypothesis if
Diagnostic Tests For Regressions Expected distribution of residuals for a linear model with normal distribution or residuals (errors).
Diagnostic Tests For Regressions Residuals for a non-linear fit
Diagnostic Tests For Regressions Residuals for a quadratic function or polynomial
Diagnostic Tests For Regressions Residuals are not homogeneous (increasing in variance)
Regression – important points • Ensure that the range of values • sampled for the predictor variable • is large enough to capture the full • range to responses by the response • variable.
Y X Y X
Regression – important points 2. Ensure that the distribution of predictor values is approximately uniform within the sampled range.
Y X Y X
Assumptions of Regression 1. The linear model correctly describes the functional relationship between X and Y.
Assumptions of Regression 1. The linear model correctly describes the functional relationship between X and Y. Y X
Assumptions of Regression 2. The X variable is measured without error Y X
Assumptions of Regression 3. For any given value of X, the sampled Y values are independent 4. Residuals (errors) are normally distributed. 5. Variances are constant along the regression line.
The linear model with a single predictor variable X can easily be extended to two or more predictor variables.
Common variance explained byX1 and X2 Unique variance explained by X2 X2 X1 Y Unique variance explained byX1 Variance NOT explained byX1and X2
A “good” model X1 X2 Y
Partial Regression Coefficients intercept residuals Partial Regression Coefficients (slopes):Regression coefficient of X after controlling for (holding all other predictors constant) influence of other variables from both X and Y.
The matrix algebra of Ordinary Least Square Intercept and Slopes: Predicted Values: Residuals:
Regression Statistics How good is our model?
Regression Statistics Coefficient of Determination to judge the adequacy of the regression model
Regression Statistics n = sample size k = number of independent variables Adjusted R2 are not biased!
Regression Statistics Standard Error for the regression model
ANOVA at least one! ANOVA to test significance of regression