Download
1 / 61
620 likes | 737 Views
Results from the Mars Express Active Ionospheric Sounder. D. D. Morgan 1 , D. A. Gurnett 1 , D. L. Kirchner 1 , F. Duru 1 , R. L. Huff 1 , D. A. Brain 2 , W. V. Boynton 3 , M. H. Acuña 4 , E. Nielsen 5 , A. Safaeinili 6 , J. J. Plaut 6 , G. Picardi 7

E N D
Results from the Mars Express Active Ionospheric Sounder D. D. Morgan1, D. A. Gurnett1, D. L. Kirchner1, F. Duru1, R. L. Huff1, D. A. Brain2, W. V. Boynton3, M. H. Acuña4, E. Nielsen5, A. Safaeinili6, J. J. Plaut6, G. Picardi7 1Department of Physics and Astronomy, University of Iowa, Iowa City, Iowa 2Space Physics Research Group, Space Sciences Laboratory, University of California, Berkeley, California 3Lunar and Planetary Laboratory, University of Arizona, Tucson, Arizona 4NASA Goddard Space Flight Center, Greenbelt, Maryland 5Max-Planck-Inst. For Solar System Research, Katlenburg-Lindau, Germany 6Jet Propulsion Laboratory, Pasadena, California 7Infocom Department, “La Sapienza,” University of Rome, Rome, Italy
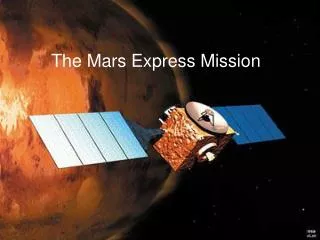
Mars Express Dec. 25, 2003 P-03-14 Dipole Antenna: 2 x 20 m
Nominal Mars Express Orbital Parameters at Insertion • Orbital Inclination: 86.3° • Apocenter: 11,560 km (altitude) • Pericenter: 258 km (altitude) • Orbital period: 7.5 h • Observing time about periapsis: ~1h
Summary of Active Ionospheric Sounder sequence • 160 frequencies sampled between 0.1 and 5.4 MHz (receive frequencies can be varied). • 1 pulse every 7.857 ms, bandwidth = 10 kHz • 80 receive times per frequency , 91.4 μs/sample • Complete cycle every 7.543 s (data rate limited).
Ionogram inversion • Time delay equation:
Topics of Interest • Maximum electron density and total electron content • Detection of magnetic fields • Double and complex traces and oblique echoes • Surface reflection and ionospheric absorption • Ionogram inversion • Spacecraft local electron density • Total electron content
Maximum Electron Density Versus Solar Zenith Angle From Gurnett et al.,2005
Safaeinili et al. LPSC, 2006
Ionogram inversion • Time delay equation:
Corrected altitude Apparent altitude
Comparison of the Measured and Model Magnetic Field Strength
Comparison of Oblique Echoes to Crustal Magnetic Fields
Surface reflection visibility statistic • V = 0 for “not visible” or 1 for “visible”, tabulated for each ionogram. • We select ionograms at 850 km ± 10 km altitude (10 ionograms) and average v.
Comparison with other data sets • Averaged surface reflection visibility. • Background of Mars Global Surveyor Electron Reflectometer (>10 MeV) with two hour smoothing to remove orbit signature. • Background of Mars Odyssey Gamma Ray Spectrometer (> 10 MeV). • GOES-12 Solar Environment Monitor soft x-ray flux (Earth). • NOAA daily X and M class flare counts.
Table 1: Absorption Events Event # Start End ΔT, days 1 20050710-09:31 20050725-08:33 15.0 2 20050801-06:33 20050808-14:06 7.3 3 20050823-03:10 20050827-07:51 4.2 4 20050901-02:23 20050904-11:12 3.4 5 20050905-13:53 20050923-18:16 18.2 ?