Download
1 / 17
180 likes | 301 Views
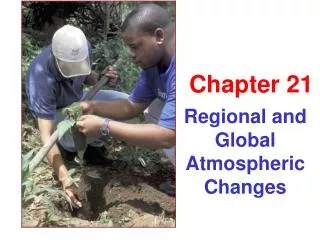
Chapter 12: Regional and Global Atmospheric Change. Acid Deposition Stratospheric Ozone Depletion Global Climate Change. Acid Deposition. Formation and Extent Emissions and Sources Effects on the Environment Control and Management. Distribution of Acid Deposition.

E N D
Chapter 12: Regional and Global Atmospheric Change • Acid Deposition • Stratospheric Ozone Depletion • Global Climate Change Exploitation, Conservation, Preservation 4e Cutter and Renwick 2003
Acid Deposition • Formation and Extent • Emissions and Sources • Effects on the Environment • Control and Management Exploitation, Conservation, Preservation 4e Cutter and Renwick 2003
Distribution of Acid Deposition Figure 12.1: Areas with existing or potential acid deposition problems. Exploitation, Conservation, Preservation 4e Cutter and Renwick 2003
Formation of Acid Deposition Figure 12.2: Formation and deposition of acid precipitation. Exploitation, Conservation, Preservation 4e Cutter and Renwick 2003
SO2 and NOx Contributors Percent change, 1990 to 1996. See Table 12.1 for details. Exploitation, Conservation, Preservation 4e Cutter and Renwick 2003
Sulfur Dioxide Emissions in U.S. Figure 12.3: Sulfur dioxide emissions in 1999 were greatest in the Ohio Valley and Texas. Exploitation, Conservation, Preservation 4e Cutter and Renwick 2003
Nitrous Oxides Emissions in U.S. Figure 12.3: Nitrous oxides emissions in 1999 were greatest in Texas, Illinois, Ohio, and California, with no strong regional concentration. Exploitation, Conservation, Preservation 4e Cutter and Renwick 2003
U.S. Acid Precipitation Figure 12.4: Year 2000 precipitation pH levels are lower in the eastern half of the United States. Exploitation, Conservation, Preservation 4e Cutter and Renwick 2003
Forest Damage Figure 12.5: Damage to the famous Black Forest of southern Germany helped to galvanize public opinion against sulfur emissions. Exploitation, Conservation, Preservation 4e Cutter and Renwick 2003
Building Damage Figure 12.6: This sculpture in Germany experienced less damage in the 200 years prior to the first photograph than it did in the 60 years between the two images. Exploitation, Conservation, Preservation 4e Cutter and Renwick 2003
Stratospheric Ozone Depletion • Ozone-Depleting Chemicals • The Ozone Hole is Discovered • Reducing ODCs: The Montreal Protocol Exploitation, Conservation, Preservation 4e Cutter and Renwick 2003
Major Ozone-Depleting Chemicals See Table 12.3 in text for a more complete list. Exploitation, Conservation, Preservation 4e Cutter and Renwick 2003
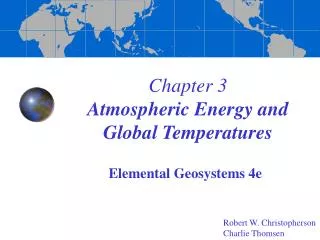
Global Climate Change • The Greenhouse Effect • Greenhouse Gases • Greenhouse Politics and Emissions Stabilization Exploitation, Conservation, Preservation 4e Cutter and Renwick 2003
Carbon Dioxide Trends Figure 12.8: Atmospheric concentrations of CO2 at Mauna Loa, 1958 to 2000. Annual fluctuations have been removed. Exploitation, Conservation, Preservation 4e Cutter and Renwick 2003
Key Greenhouse Gases Trends in ambient levels of key greenhouse gases. See Table 12.5 in text for details. Exploitation, Conservation, Preservation 4e Cutter and Renwick 2003
Carbon Dioxide Emissions Figure 12.9: Per capita emissions by country. Exploitation, Conservation, Preservation 4e Cutter and Renwick 2003
ISSUES • 12.1: Black Market Freon • 12.2: The Costs of Global Warming Exploitation, Conservation, Preservation 4e Cutter and Renwick 2003