Download
1 / 35
350 likes | 570 Views
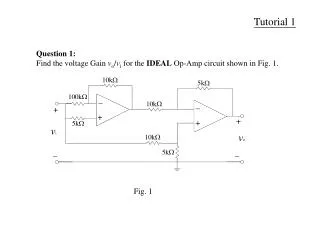
Comp4611 Tutorial 1. Computer Processor History Die Cost Calculation Performance Measuring & Evaluation Sept. 10 2014. Overview. Computer Processor History A Brief Summary of Intel Microprocessors Die Cost Calculation Performance Measuring & Evaluation.

E N D
Comp4611 Tutorial 1 Computer Processor History Die Cost Calculation Performance Measuring & Evaluation Sept. 10 2014
Overview • Computer Processor History • A Brief Summary of Intel Microprocessors • Die Cost Calculation • Performance Measuring & Evaluation
Advances Come from Design- A Brief History of Intel Microprocessors • 4 bits processor • 8 bits processors • 4004 (1971) • Intel's first microprocessor • 8080 (1974) • brains of the first personal computer • ~US$ 400 • 8008 (1972) • twice as powerful as the 4004 • 16 bits processor • 8086 – 8088 (1978) • brains of IBM's new hit product -- the IBM PC • The 8088's success propelled Intel into the ranks of the Fortune 500, and Fortune magazine named the company one of the "Business Triumphs of the Seventies." • 80286 (1982) • first Intel processor that could run all the software written for its predecessor • Within 6 years of its release, an estimated 15 million 286-based personal computers were installed around the world.
4 Advances Come from Design- in the 80’s • 32 bits processors • 80386 (1985) • 275,000 transistors--more than 100times as many as the original 4004 • 32-bit chip • "multi tasking" • 80486 (1989) • 32 bit chip • built-in math coprocessor • packaged together with cache memory chip • command-level computer point-and-click computing • color computer
Advances Come from Design- in the 90’s • Pentium (1993) • incorporate "real world" data such as speech, sound, handwriting and photographic images • Pentium Pro (1995) • 5.5 million transistors • packaged together with a second speed-enhancing cache memory chip, • pipelining • enabling fast computer-aided design, mechanical engineering and scientific computation • Pentium II (1997) • 7.5 million-transistor • MMX technology, designed specifically to process video, audio and graphics data efficiently • high-speed cache memory chip • Celeron (1999) • excellent performance in gaming
Advances Come from Design- in the Millenniums' • Pentium III (1999) • 9.5 million transistors, 0.25-micron technology • 70 new SSE (Streaming SIMD Extension) instructions • dramatically enhance the performance of advanced imaging, 3-D, streaming audio, video and speech recognition applications, Internet experiences • Pentium 4 (2000) • 42 million transistors and circuit lines of 0.18 microns • 1.5 gigahertz (4004 ran at 108 kilohertz ) • SSE2 instructions, more pipeline stages, higher successful prediction rate • can create professional-quality movies; deliver TV-like video via the Internet; communicate with real-time video and voice; render 3D graphics in real time; quickly encode music for MP3 players; and simultaneously run several multimedia applications while connected to the Internet.
Advances Come from Design- in last decade • 64 bits processors • Pentium D (2005) • Dual-core processing technology • high-end entertainment: multimedia entertainment, digital photo editing, multiple users and multitasking • Pentium Dual-Core (2007) • High-value performance for multitasking (CPU executes more instructions in less time) • Smart Cache: smarter, more efficient cache and bus design • enhanced performance, responsiveness and power savings • Core 2 Duo (2006) • A dual-core CPU • A new microarchitecture to replace Netburst • Memory Hierarchy System • Low power consumption • Core™2 Quad (2008) • Four execution cores • More intensive entertainment and more media multitasking
Advances Come from Design - Nowadays ( Consumer Level ) • Core™2 iseries (2008) • aims at • Reducing idle power • Boosting performance by increasing processor frequency • Hyper-threading • Core™2 i3 • A dual-core CPU • Core™2 i5 • A quad-core CPU • Core™2 i7 • A quad-core CPU (up to 8 cores)
Advances Come from Design - Nowadays ( Server Level) Xeon Series TheXeon is a brand of multiprocessing- or multi-socket-capable microprocessors designed and manufactured by Intel targeted at the non-consumer workstation, server, embedded systems markets. • E3 series "Sandy Bridge“ • Quad-core, enables ECC memory • E5 v2 series "Ivy Bridge • Hexa-core to Eight-core • E5 v3-series "Haswell" • Up to 14 cores inside. Latest Architecture, better energy efficiency and CPU speed
Advances Come from Technology- A Comparison Increase in processor performance due to the growth in CPU Transistor Count
Overview • Computer Processor History • A Brief Summary of Intel Microprocessors • Die Cost Calculation • Performance Measuring & Evaluation
Cost of an Integrated Circuit wafer die Where α is a parameter inversely proportional to the number of mask Levels, which is a measure of the manufacturing complexity. For today’s CMOS process, good estimate is α = 3.0 – 4.0 Yield: the percentage of manufactured devices that survives the testing procedure
Example: Die Cost Given:wafer 30cm, die 1cm, defect density 0.6 per cm2 , α=4.030-cm-diameter wafer with 3-4 metal layers : $3500wafer yield is 100% Calculate: die cost • To calculate the die cost, • Given wafer cost • Dies/Wafer? • Die Yield?
Example: Die Cost Given:wafer 30cm, die 1cm, defect density 0.6 per cm2 , α=4.030-cm-diameter wafer with 3-4 metal layers : $3500wafer yield is 100% Calculate: die cost Step 1: dies per wafer
Example: Die Cost Given:wafer 30cm, die 1cm, defect density 0.6 per cm2 , α=4.030-cm-diameter wafer with 3-4 metal layers : $3500wafer yield is 100% Calculate: die cost Step 2: die yield
Example: Die Cost Given:wafer 30cm, die 1cm, defect density 0.6 per cm2 , α=4.030-cm-diameter wafer with 3-4 metal layers : $3500wafer yield is 100% Calculate: die cost Step 3: die cost
Overview • Computer Processor History • A Brief Summary of Intel Microprocessors • Die Cost Calculation • Performance Measuring & Evaluation
How to Measure Performance ? • Performance Rating • CPU Time • Benchmark programs • Integer programs and floating point programs • Compression • Compiler • Artificial Intelligence • Physics / Quantum Computing • Video Compression • Path-finding Algorithms • Comparing & Summarizing Performance • Amdahl’s Law
Measuring Performance- CPU Execution Time • Performance = 1 / Execution Time CPU time = Seconds = Instructions x Cycles x Seconds Program Program Instruction Cycle Instruction count Clock cycle = 1 / Clock rate CPI
Measuring CPU Time – Example 1 A SPEC CPU2006 integer benchmark (464.h264ref, a video compression program written in C) is run on a Pentium D processor: Total instruction count: 3731 billion Average CPI for the program: 2.5 cycles/instruction. CPU clock rate: 2.1 GHz CPU time = Instruction count x CPI x (1/clock rate) • CPU time = 3731 x 109 x 2.5 / (2.1 x 10⁹) • = 4442 seconds Source: Analysis of Redundancy and Application Balance in the SPEC CPU2006 Benchmark Suite
Speedup = Old CPU time = 4442 = 1.999 • New CPU time 2222 Comparing Performance – Example 2 Suppose SPEC CPU2006 integer benchmark (464.h264ref) is run on a faster processor, with a new compiler: New total instruction count: 2000 billion New average CPI for the program: 4 cycles/instruction. New CPU clock rate: 3.6 GHz Speedup = Old Execution Time = Iold x CPIold x Clock cycleold New Execution Time Inew x CPInew x Clock Cyclenew • New CPU time = 2000 x 109 x 4 / (3.6 x 10⁹) • = 2222 seconds
Speedup = Iold x 2 x Clock cycleold Inew x 2.2 x Clock cyclenew Comparing Performance – Example 3 Speedup = Old Execution Time = Iold x CPIold x Clock cycleold New Execution Time Inew x CPInew x Clock Cyclenew Question: Should the new design be implemented? Old CPI = 0.40 x 3 + 0.2 x 1 + 0.2 x 1 + 0.2 x 2 = 2 New CPI = 0.4 x 2 + 0.2 x 2 + 0.2 x 2 + 0.2 x 3 = 2.2 Answer: Shouldn’t be implemented = 0.91
Metrics for Performance CPU Time = Instruction Count x CPI x Clock Cycle Time CPU time: most accurate and fair measure a priori frequency of the instruction set
Measuring Performance – Example 4 • Suppose we have made the following measurements: Frequency of FP operations (other than FPSQR) = 23% Average CPI of FP operations (other than FPSQR) = 4.0 Frequency of FPSQR = 2%, CPI of FPSQR = 20 Average CPI of other instructions = 1.33 • Assume that the two design alternatives • decrease the CPI of FPSQR to 3 • decrease the average CPI of FP operations (other than FPSQR) to 2. • Compare these two design alternatives using the CPU performance equation.
Solution Step 1: Original CPI without enhancement: CPI original= 423% + 20x2% +1.3375% = 2.3175 Step 2: compute the CPI for the enhanced FPSQR by subtracting the cycles saved from the original CPI: CPI with new FPSQR = CPI original - 2%(CPI old FPSQR – CPI new FPSQR only) = 2.3175 - 0.02x(20-3) = 1.9775 Step 3: compute the CPI for the enhancement of all FP instructions: CPI with new FP = CPI original - 23%(CPI old FP – CPI new FP) = 2.3175 - 0.23x(4-2) = 1.8575 Step 4: the speedup for the FP enhancement over FPSQR enhancement is: Speedup = CPU time with new FPSQR / CPU time with new FP = (I CPI with new FPSQR C) / (I CPI with new FP C) = CPI with new FPSQR / CPI with new FP = 1.9775 / 1.8575 = 1.065
UNCLEAR Comparing & Summarizing Performance - By total execution time • Total execution time How much faster is Machine B than Machine A? 9.1 times? Machine A is faster in running Program 1. Machine B is faster in running Program 2.
1 n • n • Execution Timei • i=1 Can be misleading Valid only if programs run equally Comparing & Summarizing Performance- by arithmetic mean of execution time Arithmetic Mean:
Comparing & Summarizing Performance- by weighted arithmetic mean of execution time • n • Weighti x Execution Timei • i=1 Weighted Arithmetic Mean: For the 1st of Weights: Machine A is better
Comparing & Summarizing Performance- by weighted arithmetic mean of execution time • n • Weighti x Execution Timei • i=1 Weighted Arithmetic Mean: For the 2nd set of Weights: Machine B is better It depends very much on how to weigh each testing item
Same GM ≠ same execution time or same performance Comparing & Summarizing Performance- by geometric mean of execution time n Geometric Mean: n • Execution time ratioi I=1 Normalized Execution Time to a reference machine
References: • John L. Hennessy and David A. Patterson. Computer Architecture: A Quantitative Approach. Morgan Kaufman Publishers, 5th Edition, 2011 • Intel • http://www.intel.com • http://www.intel.com/content/www/us/en/history/museum-story-of-intel-4004.html • http://www.intel.com/pressroom/kits/quickrefyr.htm • Timeline of Microprocessor http://m.theinquirer.net/inquirer/feature/2124781/microprocessor-development
Amdahl’s Law – law of diminishing returns In general case, assume several enhancements has been taken for the system, the speedup for whole system is: whereFi is the fraction of enhancement i and Si is the speedup of the corresponding enhancement The new execution time is Appendix : Amdahl’s Law
Amdahl’s Law - An Example • Float instruction: • Fraction: 50% • Speedup: 2.0x • Integer instruction: • Fraction: 30% • Speedup: 3.0x • Others keep the same. = 1 / ((1-0.5-0.3)+(0.5/2+0.3/3))=1.818
Amdahl’s Law - Intuition: “Make the common case faster” • I have two processors, which can help accelerate one of the below parts by parallel processing. Two parts occupy the total time percentage of 95% and 5%. • Fractionenhanced= 95%, Speedupenhanced= 2.0x Speedupoverall= 1/((1-0.95)+0.95/2) = 1.905 • Fractionenhanced= 5%, Speedupenhanced= 2.0x Speedupoverall= 1/((1-0.05)+0.05/2) = 1.026 1.905 vs. 1.026 Make the common case faster!! • Fractionenhanced= 5%, Speedupenhanced-> infinity Speedupoverall= 1/(1-0.05) = 1.052 1.052 is still much smaller than 1.905.
Method 1: CPI Method 2: Amdahl’s Law The fraction in Amdahl’s law is time fraction Method 2: Amdahl’s Law A Common Confusion: CPI vs. Amdahl’s Law • Assume a program consists of three classes of instructions A,B and C, as shown below. • An enhancement is made by doubling the speed of instruction class A • Assume instruction count for the program and CPU clock cycle is not influenced • What is the overall speedup achieved for the program