Download
1 / 43
430 likes | 570 Views
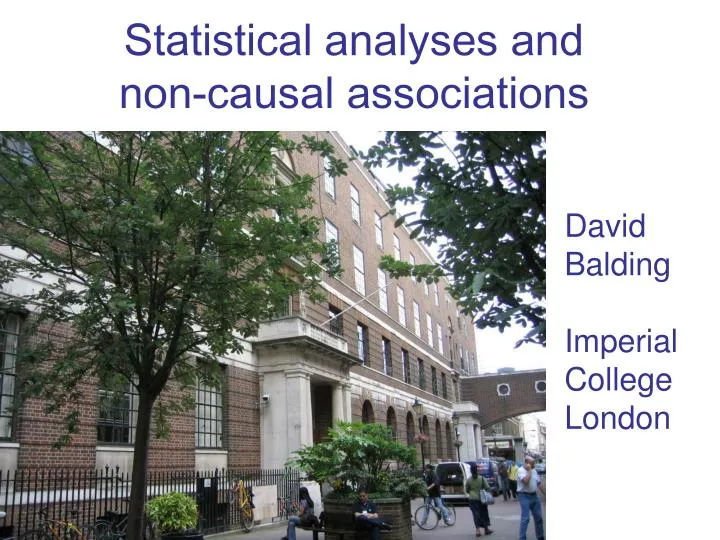
Statistical analyses and non-causal associations. David Balding Imperial College London. Genetic Epidemiology has traditionally been based on linkage methods, that trace transmissions of marker alleles and phenotypes within families.

E N D
Statistical analyses and non-causal associations David Balding Imperial College London
Genetic Epidemiology has traditionally been based on linkage methods, that trace transmissions of marker alleles and phenotypes within families. This approach focusses directly on the quantities relevant to genetic causes of disease few opportunities for non-causal correlations ascertainment bias tends to inflate effect estimates BUT, it’s hard to find enough families to detect low-penetrant alleles, AND Linkage regions are usually large (1 – 10 Mb) Most useful for rare, high-penetrant alleles, and analysis of many phenotypes (e.g. in model species) Linkage vs Association
The advent of dense SNP genotyping has permitted the use of unrelated individuals in population association methods can use almost any individuals finer resolution No longer possible to track transmissions directly just compare allele/genotype proportions in individuals of different disease states More opportunities for non-causal associations e.g. cases and controls may differently represent particular groups with different allele proportions Linkage vs Association
Rationale for association studies • There is no such thing as “unrelated” • it just means that the relatedness is unknown and presumed to be distant • Association studies rely on at least a subset of cases inheriting a disease-predisposing mutant from a common ancestor
Genealogy at causal locus (haploid) Carrier Non-carrier major mutation time
Case Control case-rich cluster of haplotypes that are similar in the vicinity of the causal variant
Cases chromosomes in the “cluster” Founder haplotype carried by the MRCA of the sample of case chromosomes indicated by the black regions. Recombination events occur with random chromosomes from the population. Founder haplotype replaced with background genetic material indicated by white regions. Founder haplotype preserved in region directly flanking the disease locus
Complications Multiple disease mutations may occur at the same, or proximal loci. Dominance and sporadics mean many case chromosomes don’t carry a disease mutation.
Nevertheless, allele proportions at flanking markers L and R tend to differ between case and control chromosomes L R
Effect of mutation history • Most association studies have little prospect of directly typing the causal polymorphism. • They rely on a typed marker in the vicinity of a causal polymorphism and hence potentially in LD with it. • Two common measures of LD between 2 markers • D’ is sensitive to no recombination between them • r2where r is the correlation coefficient for haplotype data. It is more important for association studies since it reflects sample size/power to detect LD. • LD depends on recombination and mutation history at the loci.
Complete linkage r2 = 1/7 0 0 0 0 1 1 1 1 Locus A 1 0 0 0 0 0 0 0 Locus B
Complete linkage r2 = 3/5 0 0 0 0 1 1 1 1 Locus A 0 0 0 0 0 1 1 1 Locus B
Complete linkage r2 = 1 0 1 1 1 0 0 0 0 Locus A 0 1 1 1 0 0 0 0 Locus B
Possible route to non-causal association I. Genotyping errors • Rates of miscalls and non-calls can differ • between cases and controls and • according to genotype • Standard to monitor call rates and HWE • HWE is independence of an individual’s two alleles at a locus. Deviation can be due • genome-wide effects of inbreeding/population structure • selection • deletion or other copy-number polymorphism
Testing for association at SNP markers 1. SNP variables 0 0 2 1 1 0 0 0 1 1 0 0 2 1 1 0 1 0 0 1 1 1 0 0 0 1 1 1 0 0 1 0 0 1 1 2 case control case control control case 10 3 9 6 4 7 Quantitative phenotypes: more informative than binary 2. Haplotype variables
Single-SNP tests • General tests: Fisher exact • similar behaviour to Bayes Factor under either prospective or retrospective likelihood • Tests tailored to specific alternatives: • dominant, recessive, additive • can use maximum of the three statistics • Most popular tests can be derived as score tests of corresponding logistic regression models
Armitage’s Test for Trend Score test for logistic regression: where X denotes genotype score. T2 has 2 distribution with 1df. Can adjust for covariates: genotype score is weighted according to linear regression of age on disease status (so old cases and young controls are both downweighted)
SNP-based analyses: multipoint • Usually based on logistic regression • can add a single dominance term (1 extra df) for an unobserved causal SNP at a candidate locus (Chapman et al 2003) • Often some kind of variable selection procedure is implemented, e.g. stepwise selection using AIC • missing data problematic • An alternative is to use Bayesian logistic regression with a “shrinkage” prior, e.g. LASSO algorithm (Tibshirani, 1996) implemented by Genkin et al., http://www.stat.rutgers.edu/~madigan/BBR/ • Score test is the multivariate Armitage test, similar to Hotelling’s T2, null distribution is 2 with df = #SNPs. Requires preliminary “tagging” step to identify a set of low-correlated SNPs
Haplotype-based analyses • problem with SNP-based analysis: large number of highly-correlated predictors • “block-like ” structure of human genome: high statistical dependence within blocks, low between blocks. • so analyse haplotypes within blocks as classical alleles. Recombination hotspots Blocks of strong LD / few haplotypes
Inferring phase • Problem with haplotype-based approaches: we do not observe haplotypes but multilocus genotypes (= sum of haplotypes). • there exists good statistical methods to infer haplotypes from genotype data • but it can be hard to give proper weight to the uncertainty arising from the haplotype inference when making final inferences
Problems with haplotype analyses: • Block model of human genome gives an imperfect reflection of reality • Does not model evolutionary relatedness of haplotypes (two similar haplotypes may both bear hidden causal variant) • No satisfactory way to deal with rare alleles.
founding mutation Haplotype clustering “cladistic” methods possible genealogical history at main cluster: 8 case 4 control case control Secondary cluster: minor mutant? • haplotypes close in • space: • similar genealogy • similar risk
Possible route to con-causal association II • Inadequate control of type-1 error due to • multiple testing or, • overly optimistic prior on causal effect
Problem not different in principle in genetics relative to other fields, but • huge size of genome: millions of SNPs and structural polymorphisms that could be causal • many possible tests of each polymorphism • many possible phenotype definitions • Standard solutions are available • control of FWER via Bonferroni correction or permutation • simple, popular, illogical • control of FDR • Bayesian analysis with explicit priors • complex, unpopular, logical
Log QQ plots can be useful Observed p-value expected p-value
Possible route to con-causal association III • Cryptic relatedness • apparently unrelated sets of individuals over-represented in cases • Cryptic population stratification: genome-wide pattern of association with phenotype due different representation of population groups among individuals with different disease state. Can be caused by • allele frequency variation at causal SNP • differing penetrances (e.g. due to environment) • ascertainment bias
100 SNPs simulated in a 500Kb interval; causal SNP at 0. No population structure 5 equal subpops, Fst=8%
Effect of population structure on the analysis of genetic association studies: Cases Controls Subpop 1 Subpop 2 Allele 1 Allele 2 Useful didactic model but doesn’t always match reality
Genealogy at causal locus: binary ph’type Case Control mutation Association mapping seeks case-rich cluster of similar alleles
BUT if local allele sharing reflects genome-wide allele-sharing due to pedigree: spurious positives
The hidden (cryptic) substructure problem for association studies is really a problem that the (unobserved) pedigree is a confounder. • same as problem of cryptic relatedness but at different time scales • Pedigree effects can be diagnosed and corrected using many genome-wide markers • assess local effects “orthogonal to” genome-wide effects
Current Approaches to allowing for cryptic substructure • Design-based: • Family-based designs, e.g. TDT or sib-TDT • Analysis-based: • Genomic Control • Structured association Both use genome-wide “null” markers.
TDT: pros and cons Provides good protection against false positives due to population structure, and can investigate parent-of-origin effects, but at a high cost: • need to find and genotype both parents of every affected individual • 50% more genotyping • parents not always available
Genomic Control (GC)(Devlin & Roeder 1999) • Calculate test statistic ( : Armitage trend test) at each of the null markers. • Divide empirical median by median of χ2 with 1df (=0.455); call the result λ. • At markers of interest, use as test statistic; has χ2 distribution with 1df.
Genomic Control (GC) The average inflation of χ2 statistics at the null markers, λ, is used to “shrink” the χ2 statistics at the markers of interest. –simple and computationally fast – inflexible: single point analyses – all SNPs adjusted in same way –loss of power in some settings
Structured Association Use null markers to assign individuals to subpopulations, then test for association within subpopulations at candidate markers. • Pritchard et al. (2000): STRUCTURE/STRAT Bayesian/MCMC clustering, LR-based test • Satten et al. (2001): latent class analysis using EM. • Hoggart et al. (2003): ADMIXMAP Bayesian/MCMC clustering, score-based classical test.
Problems with SA methods –computationally demanding – inflexible subpopulation model – no correct number of subpopulations –loss of power when population structure is weak
New approaches1. Logistic Regression(Setakis et al. 2006) • Consider each null SNP as covariate • Reduce df by either • backwards stepwise selection • Bayesian: Laplace prior • Advantages: • Computationally fast • Flexible: multiple causal variants; any pedigree
New approaches2. Eigenstrat(Price et al. 2006) • uses Principal Components rather than individual SNPs • adjust both phenotype and genotype to remove effects attributable to first few PCs • equivalent to including PCs as regression covariates
New approaches3. Mixed model approach(Yu et al. 2006) distinguishes subpopulation (Q) and kinship (K) effects in linear mixed model: y = Sα + Qv + ε where S is genotype at candidate SNP, ε ~ N(0,γ2(σ2R+I)) and R is an estimated kinship matrix • computationally slow, doesn’t deal with ascertainment bias
Nature Reviews Genetics 7, 781-791 (October 2006) doi:10.1038/nrg1916
Conclusions • Issues of causality less problematic for genetic than for other risk factors; c.f. passive smoking • also low ORs, around 1.1 – 1.2, BUT • null of zero effect seems implausible • many possible confounders, most hard to measure • Problems of genotyping error, low prior probability and confounding due to relatedness are reasonably well understood and there exist methods to assess and address them