Download
1 / 9
90 likes | 185 Views
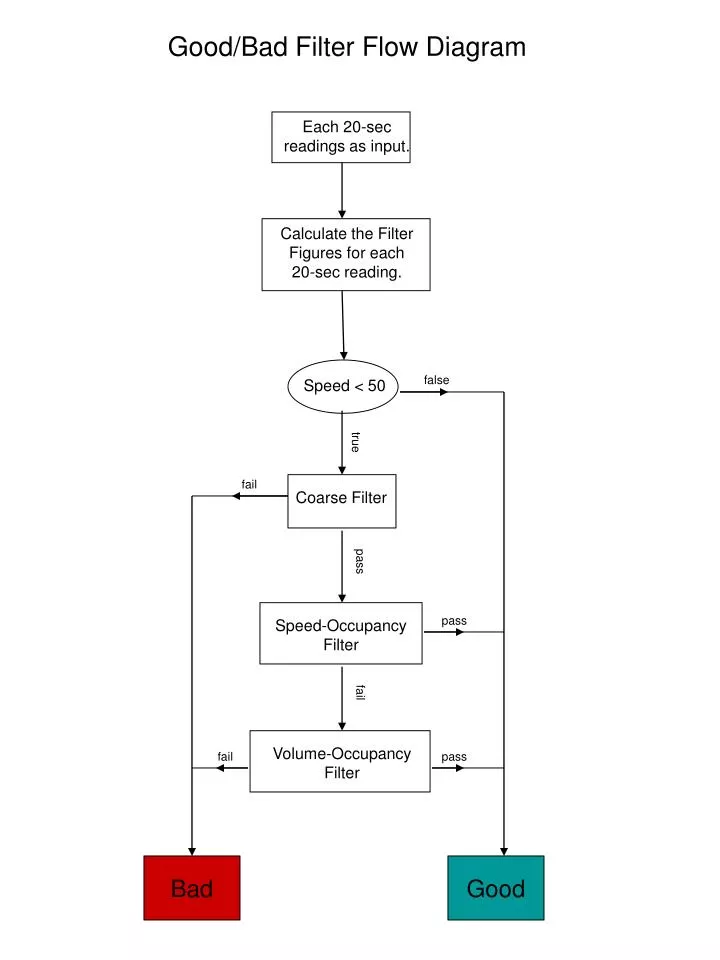
Good/Bad Filter Flow Diagram. Each 20-sec readings as input. Calculate the Filter Figures for each 20-sec reading. false. Speed < 50. true. fail. Coarse Filter. pass. pass. Speed-Occupancy Filter. fail. Volume-Occupancy Filter. fail. pass. Bad. Good.

E N D
Good/Bad Filter Flow Diagram Each 20-sec readings as input. Calculate the Filter Figures for each 20-sec reading. false Speed < 50 true fail Coarse Filter pass pass Speed-Occupancy Filter fail Volume-Occupancy Filter fail pass Bad Good
Input: one 20 second reading and corresponding Filter Figures. true volume == NULL false true Coarse Filter vlength < 3 false true vlength > 30 false true speed == 0 false true cmes > 5 false false speed < 40 true false nmes < 1.5 true true vlength > 25 false false speed < 20 true false true vlength > 20 FAIL PASS
Input: one 20 second reading and corresponding Filter Figures. Volume-Occupancy Filter true nmes < 3.334 false true vlength < 6.5 false true true cmes < .001 vlength < 8 false false true cmes < .5 vlength < 9 true false false true false nmes < 8.5 cmes < 1.0 true false true nmes < 7 false true true true speed >= 40 nmes <= 5 vlength < 12 false false false true true true nmes < 8.5 nmes < 8.5 40 <= speed < 46 vlength < 13 false false false false true true true speed < 40 nmes <= 5 vlength < 15 false false false false volume <= 2 true FAIL true false occupancy <= 2 PASS
Input: one 5 minute timeslice and corresponding Aggregation Figures Pick Filter alls true false 6:40 < time <= 19:40 7:00 < time <= 20:00 true false false true true nogood false true nogood false true false false nogood filter true filter true false false Sn < 55 true true ΔSan > 5 false false time.hour = 6 OR 19 true false filter true false true ΔSan > 5 true Sa == NULL false FILTER NOZEROS ALL
Input: one 5 minute timeslice and corresponding Aggregation Figures Fidelity Filter speed_all > speed_nozeros true Sn >= 55 40 <= Sn < 55 Sn < 40 false false ΔSan > 8 ΔSan > 5 true true true true inhibited > 0 inhibited > 0 false false true true zero_speeds > 1 zero_speeds > 4 false false true true total_bad > 3 total_bad > 5 false false true true suspect > 5 total_bad + suspect > 7 false false true total_bad + suspect > 7 30 <= Sn < 40 false true false ΔSan > 10 Sn < 30 true false true ΔSan > 15 false FALSE TRUE
No-good Filter Input: one 5 minute timeslice and corresponding Aggregation Figures true inhibited > 3 false true zero_speeds > 6 false true total_bad > 7 false true total_bad + suspect > 10 false true Sn > 50 false true false length/TTn < 50 FALSE TRUE
Truck Traveltime Filter Input: one 5 minute timeslice and corresponding Aggregation Figures false TTn > 0 true false TTa > 0 true false abs(Sn – length/TTn) > 6 true false abs(Sa – length/TTa) > 6 true false length/TTn < 55 true false length/TTa < 55 true TRUE FALSE
Traveltime Filter Input: one 5 minute timeslice and corresponding Aggregation Figures false TTn > 0 true false length/TTn < 55 true true abs(Sn – length/TTn) > 5 false false length/TTn < 55 true true false Sn > 55 TRUE FALSE
The boolean values nogood, alls, and filter are uses in the Pick Filter and are defined below. One 5min timeslice and corresponding Aggregation Figures = nogood No-good Filter Traveltime Filter = alls One 5min timeslice and corresponding Aggregation Figures OR Fidelity Filter Truck Traveltime Filter = filter One 5min timeslice and corresponding Aggregation Figures OR Truck Fidelity Filter