Download
1 / 17
170 likes | 221 Views
Explore methods for evaluating fatigue under bimodal loads, covering spectral density, case studies, Gaussian processes, and non-Gaussian transformations. Case study details a semi-submersible's mooring system.

E N D
Fatigue under Bimodal Loads Zhen Gao Torgeir Moan Wenbo Huang March 23, 2006
Contents • Bimodal random process • Methods for bimodal fatigue damage assessment • Case study of mooring system of a semi-submersible
Bimodal random process • A wide-band process with a bimodal spectral density. • Examples: • Mooring line tension • Torque of propellers (or thrusters) in waves
Fatigue based on S-N curve and Miner rule • Gaussian narrow-band fatigue damage • Fatigue damage of a bimodal process where is the mean zero up-crossing rate. is the standard deviation of the process.
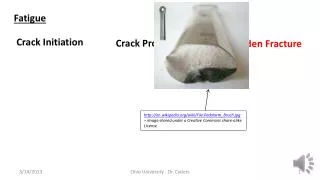
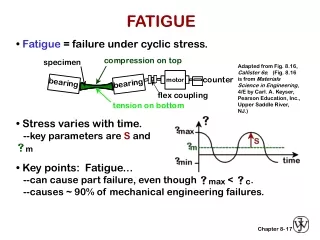
Methods for bimodal fatigue (1) • Level crossing counting • Rainflow counting • Time domain methods • Peak counting • Range counting • Spectral methods for a general wide-band Gaussian process • Wirsching & Light (1980) • Zhao & Baker (1992) • Spectral methods for a bimodal Gaussian process • Single moment method • Sakai & Okamura (1995) • DNV formula (2005) • Non-Gaussian process • Transformation (Winterstein,1988; Sarkani et al.,1994) • Dirlik (1985) • Benasciutti & Tovo (2003) • Jiao & Moan (1990) • Fu & Cebon (2000) • Huang & Moan (2006)
Methods for bimodal fatigue (2) • Jiao & Moan (1990) • DNV (2005) Assume where is the envelope process of Then For Gaussian processes, analytical formula can be obtained.
Methods for bimodal fatigue (3) • Fatigue damage estimation of a Gaussian bimodal process DNV (2005) Jiao & Moan (1990)
Case study of mooring system • A semi-submersible Main particulars of the semi-submersible • Mooring system • Line No.10 • Pre-tension of 1320 kN • Studless chain link with a diameter of 125 mm Horizontal projection of the mooring system
Mooring line tension components • Pre-tension and mean tension due to steady wind, wave and current forces (time-invariant) • LF line tension (quasi-static, long period (e.g. 1 min)) • WF line tension (dynamic, short period (e.g. 15 sec)) • Both LF and WF tension are narrow-band. • Bimodal with well-separated low and wave frequencies • Independent assumption between LF and WF tension
Low frequency (LF) line tension • Distribution of slowly-varying wave force and motion can be expressed by a sum of exponential distributions given by an eigenvalue problem (Næss, 1986) • The LF line tension can be quasi-statically determined the line characteristic (cubic polynomial, even linear) • Distribution of the amplitude of LF tension depends on the fundamental tension process and its time-derivative.
Wave frequency (WF) line tension (1) • Simplified dynamic model (Larsen & Sandvik, 1990) • Distribution of the amplitude of WF line tension (Combined Rayleigh and exponential distribution) (Borgman, 1965) Basically, it is a Morison formula with a drag term and an equivalent inertia term. is a measure of the relative importance of the drag term and the equivalent inertia term.
Wave frequency (WF) line tension (2) • Morison force Normalized: Fatigue damage due to normalized Morison force (Madsen,1986)
Scaled by the standard deviation of the fundamental process ( ) Amplitude distribution of LF and WF line tension • The amplitude distribution of LF line tension shows a higher upper tail, which indicates a larger extreme value. • While that of WF line tension is quite close to a Rayleigh distribution. Because in this case, the equivalent inertia term is dominating.
Scaled by the standard deviation of the fundamental process ( ) Fatigue damage due to combined LF and WF line tension • The amplitude distribution of the process with Gaussian and non-Gaussian cases • The mean zero up-crossing rate can be obtained by the Rice formula.
Short-term and long-term fatigue • Short-term fatigue damage • A 3-hour sea state with Hs=6.25m, Tp=12.5s, Uwind=7.5m/s, Ucurrent=0.5m/s Conditional short-term fatigue damages • Long-term fatigue damage • A smoothed northern North Sea scatter diagram Total long-term fatigue damages Smoothed scatter diagram (Joint density function)
Long-term fatigue contribution Combined WF LF D=0.065 D=0.812 D=1 Non-Gaussian D=0.053 D=0.851 D=1.017 Gaussian