Download
1 / 25
250 likes | 338 Views
An Overview of the Big Bend Regional Aerosol and Visibility Observational (BRAVO) Study. Marc Pitchford, Ph.D National Oceanic and Atmospheric Administration Mark Green, Ph.D. Desert Research Institute. Reasons for the Study.

E N D
An Overview of the Big Bend Regional Aerosol and Visibility Observational (BRAVO) Study Marc Pitchford, Ph.D National Oceanic and Atmospheric Administration Mark Green, Ph.D. Desert Research Institute
Reasons for the Study • Clean Air Act provides protection from visibility impacts at certain national parks and wilderness areas including Big Bend • Popular perception in the region that haze levels have been increasing at Big Bend • Concerns that increased emissions along the US/Mexico border are responsible for haze increases • Preliminary Big Bend Haze Study called for a source attribution study
Seasonality and components of haze Aerosol light extinction: Sulfate 41% Organic Carbon 19% Black Carbon 21% Crustal 16% Nitrate 4%
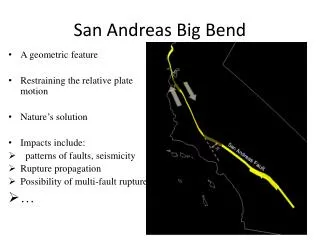
Transport Patterns Transport patterns – late July, late September
Summary of Field Study • 4 month study from July-October • Tracer release near Carbon I/II (Eagle Pass- 3 tracers) and Big Brown first half • Tracer release from Eagle Pass, San Antonio, W.A. Parish, Big Brown 2nd half • Large particulate and tracer monitoring network (but none in Mexico) • Additional upper air measurements • Visibility measurements at Big Bend • “Special” studies at Big Bend • Aircraft measurements
Data Recovery • Particulate sampling network • Complete deployment delayed ~3 weeks for new samplers • Otherwise expect high recovery • Tracer sampling network • Extended period in middle of study with only 6 tracer sampling sites due to delayed analysis capability • Most extensive tracer study ever done, even considering periods with only a few sites • High data recovery for other monitoring (visibility, meteorology, air quality)
Status of Data from Field Study Status of Data from Field Study • Tracer release data • Surface and upper air (Radar wind profiler) • Light scattering (haze) • 12-minute Sulfate, hourly SO2 at Big Bend • Photographs at Big Bend • Limited Big Bend aerosol chemical analysis
Status of Data from Field Study Status of Data from Field Study • Light extinction data – December, 2000 • Complete chemical analysis of particulate data – November, 2000 • Tracer data – January, 2001 • Source profiles – November, 2000 • Emissions – February, 2001
Data AnalysisProcess • Descriptive analysis – maps and time plots of variables, mean, standard deviation, etc. • Association analysis – relationships among variable, e.g. correlations, closure • Representativeness of study period • Attribution analysis- source and receptor models, etc. • Reconciliation of results • Conceptual model
Attribution Analysis • Multiple air quality simulation & receptor modeling methods used for attribution • Tracer data divided into subset for “training” and a sequestered subset for “testing” to evaluate methods’ performance • Study findings are developed by reconciling results of the various methods
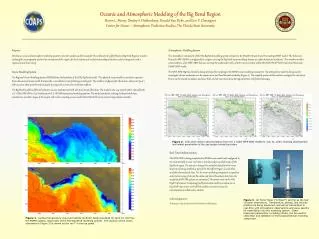
BRAVO MM5 Met. Modeling Domains Cell Sizes 36 km 12 km 4 km
Estimated Schedule • Always takes longer than planned • Get all data into database – autumn 2000 • Data analysis and modeling – end of 2001 • Reconciliation of results – March 2002 • Draft Report – May 2002 • Final report July 2002