Download
1 / 38
380 likes | 488 Views
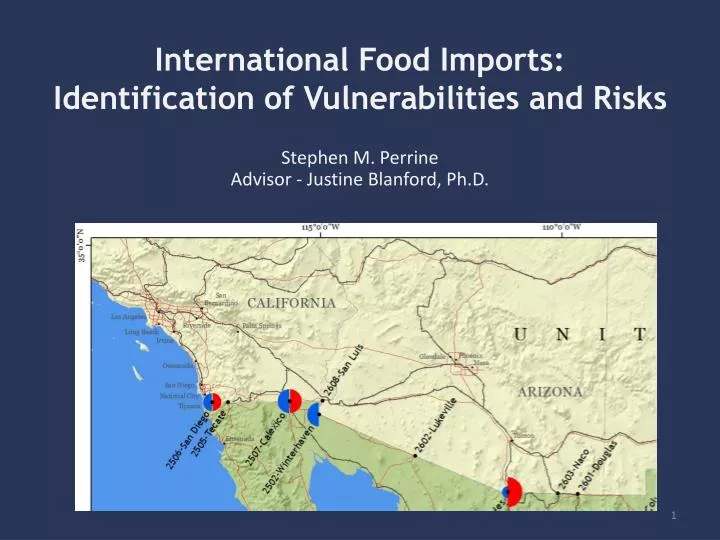
International Food Imports: Identification of Vulnerabilities and Risks. Stephen M. Perrine Advisor - Justine Blanford, Ph.D. Overview. Introduction U.S. food imports overview Unintentional food contamination Deliberate food contamination Can shipping patterns reveal risks? Methods

E N D
International Food Imports:Identification of Vulnerabilities and Risks Stephen M. Perrine Advisor - Justine Blanford, Ph.D.
Overview Introduction • U.S. food imports overview • Unintentional food contamination • Deliberate food contamination • Can shipping patterns reveal risks? Methods Preliminary Results Questions Partial contents of a commercial food courier’s checked baggage, Dulles Airport 2013
The U.S. imported food from 232 sovereign states and dependent territories in 2012 Source: FDA
The total dollar value of food imports in the U.S. increased 263% between 1999 and 2012 Source: USDA ERS
The U.S. has the safest food supply in the world, yet millions acquire foodborne illness each year Source: CDC
Most foodborne outbreaks in the U.S. are caused by Salmonella (46%) and Norovirus (99%) Source: CDC
The number of foodborne outbreaks from foreign sources is increasing Source: CDC
Deliberately contaminated food is difficult to detect and has serious public health consequences Cases of economically motivated adulteration since 1980 N=137 What about terrorism? Everstine, 2013
Worldwide, there are almost 450,000 food facilities registered with FDA 26,743 23,829 28,223 16,509 18,383 Source: FDA
Low inspection, sampling rates = high likelihood of undetected entry of contaminated food Gerald Holmes, Valent USA Corporation, Bugwood.org
Improving food safety by identifying vulnerabilities and risks in food shipments
Improving food defense by understanding movement and routing
Improving food defense by understanding movement and routing through modeling • Least-cost route likely to be due to: • Transportation costs (Fender & Pierce, 2012) • Time/food item (Osvald & Stirn, 2008) • Other (Cattan, 2011) H. Antikainen, 2013
Improving food defense by visualizationCartographic flow maps http://giswight.blogspot.com/2011/03/flow-map.html
Improving food defense by visualizationInformation visualization Network graph
Improving food defense by visualizationTime geography http://www.ecologyandsociety.org/vol8/iss2/art2/figure4.jpg
Improving food defense by visualizationGeovisualization https://www.e-education.psu.edu/geog486/node/1849
Can shipment patterns reveal risks? Objectives: • Improve food defense assessments by identifying vulnerabilities • Develop new visual analytical and spatial methodologies that will help identify shipping routes and deviations from the norm • Assess the feasibility of using advanced visual analytical methods for dealing with increasing volumes of data
Truck cargo can be highly vulnerable to deliberate contamination en route Haralambides & Londondo-Kent, 2004 http://www.csmonitor.com/World/Americas/2011/0412/Mexico-drug-war-s-latest-victim-the-lime
Methodology - Analysis • Connectivity between locations • XY Line • Cartographic flow • Visual Analytics • Port crossings • Identify, rank most favored border crossings • LCPA ? D A C
Expected Results/Outcomes – based on preliminary data analysis for 2012 Several ports on each border are most frequently used Patterns between source and destination exist Port choice from source regions will be ranked Results will be used to identify outlier shipments
2012 vegetable/vegetable product import statistics, truck carriers only * Import line = unique food item (type, packaging, etc.) in a single shipment Source: FDA
Mexican consignees are concentrated in the SW, Canadian consignees in the NE
Visual AnalyticsAll Mexican vegetable routing data, 2011 (a)
Visual Analytics All Mexican vegetable routing data, 2011 for MI (a)
Visual Analytics All Mexican vegetable routing data, 2011 for MI (b)
All Canadian vegetable shipments crossing the Sweetgrass, MT port of entry
Not all shipments originating from Regina, SK follow a least cost path 2,181 mi/37 h 1,150 mi/18 h
Port of entry characteristics will have to be incorporated into the LCPA cost surface
ZIP codes or the MGRS will be used to aggregate source & destination data for LCPA & port ranking
Problem - the manual entry of place names impedes data analysis and georeferencing
Problem - one year’s data for one food industry cannot be used to generalize all shipping patterns
Timeline Jun 14 Apr 14 Jan 14 Nov 13 Aug 13
Key References • Andrienko, N., & Andrienko, G. (2012). Visual analytics of movement: An overview of methods, tools and procedures. Information Visualization, 12(1), 3-24. • Brewster, R. M., & LeVert, R. (2005). Identifying Vulnerabilities and Security Management Practices in Agricultural & Food Commodity Transportation: American Transportation Research Institute. • Calvin, L. (2003). International Trade and Food Safety: Economic Theory and Case Studies. In J. Buzby (Ed.), Agricultural Economic Report (pp. 74-96): U.S. Department of Agriculture Economic Research Service. • Nganje, W., Richards, T., Bravo, J., Hu, N., Kagan, A., Acharya, R., & Edwards, M. (2009). Food safety and defense risks in US-Mexico produce trade. Choices, 24(2), 1-8. • Seebens, H., Gastner, M. T., & Blasius, B. (2013). The risk of marine bioinvasion caused by global shipping. Ecol Lett, 16(6), 782-790. • Tsamboulas, D., & Moraiti, P. (2008). Identification of potential target locations and attractiveness assessment due to terrorism in the freight transport. Journal of Transportation Security, 1(3), 189-207.
Questions? stephen.perrine@fda.hhs.gov