Download
1 / 77
820 likes | 968 Views
Module 1 | Anaemia an introduction. Module prepared by: Ben Woodman-Smith; Medical Student, Cardiff University Steve Allen; Professor of Paediatrics and International Health, College of Medicine, Swansea University Ann Benton; Consultant Haematologist, ABMU Health Board, Swansea. Contents

E N D
Module 1 | Anaemia an introduction • Module prepared by: • Ben Woodman-Smith; Medical Student, Cardiff University • Steve Allen; Professor of Paediatrics and International Health, College of Medicine, Swansea University • Ann Benton; Consultant Haematologist, ABMU Health Board, Swansea
Contents 1. 1Introduction 1.2 use this module 1.3 Learning outcomes 2.1. The erythrocyte 2.2. Erythropoiesis 2.3. Red cell membrane 2.4. Haematinics 2.5. Red cell metabolism 2.6. Haemoglobin 2.7. Ageing and death Quiz 1 3.0. Defining anaemia. 3.1. Prevalence 3.1. Clinical features Quiz 2 4.0. Classifying anaemia 4.1. red cell indices. 4.2. Morphological classification 4.3. Aetiological classification 5.0. Blood film: a basic interpretation. 5.1. Anaemia cards Quiz 3. 6.0. Glossary 7.0. References Contents • 1.0. Introduction anaemia • 1.1. How to use this module • 1.2. Learning outcomes The red cell life cycle • 2.0. The erythrocyte: an overview • 2.1. Erythropoiesis • 2.2. The red cell membrane • 2.3. Haematinics • 2.4. Red cell metabolism • 2.5. Haemoglobin and oxygen transport • 2.6. Ageing and death of the red blood cell. • Quiz 1 Anaemia; an overview • 3.0. Defining anaemia. • 3.1. Prevalence of anaemia • 3.2. Clinical features of anaemia • Quiz 2 Classifying Anaemia • 4.0. Classification of anaemia • 4.1. Red cell indices • 4.2. Morphological classification • 4.3. Aetiological classification of anaemia. Interpretation of Blood film • 5.0. Basic interpretation of a blood film. • 5.1. Anaemia: essential bites • Quiz 3 Glossary References please click on contents to repeat a section. Please click here to move forwards or backwards through the module
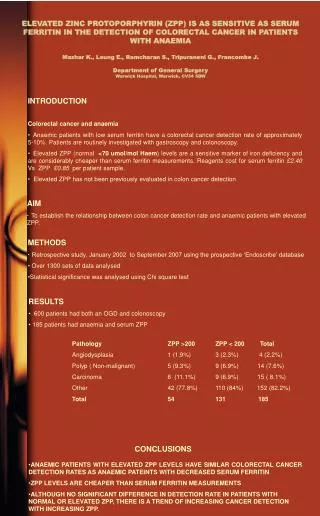
Contents 1. 1Introduction 1.2 use this module 1.3 Learning outcomes 2.1. The erythrocyte 2.2. Erythropoiesis 2.3. Red cell membrane 2.4. Haematinics 2.5. Red cell metabolism 2.6. Haemoglobin 2.7. Ageing and death Quiz 1 3.0. Defining anaemia. 3.1. Prevalence 3.1. Clinical features Quiz 2 4.0. Classifying anaemia 4.1. red cell indices. 4.2. Morphological classification 4.3. Aetiological classification 5.0. Blood film: a basic interpretation. Quiz 3. 6.0. Glossary 7.0. References Contents 1. 1Introduction 1.2 use this module 1.3 Learning outcomes 2.1. The erythrocyte 2.2. Erythropoiesis 2.3. Red cell membrane 2.4. Haematinics 2.5. Red cell metabolism 2.6. Haemoglobin 2.7. Ageing and death Quiz 1 3.0. Defining anaemia. 3.1. Prevalence 3.1. Clinical features Quiz 2 4.0. Classifying anaemia 4.1. red cell indices. 4.2. Morphological classification 4.3. Aetiological classification 5.0. Blood film: a basic interpretation. 5.1. Anaemia cards Quiz 3. 6.0. Glossary 7.0. References | Introduction 1.1 Welcome to the anaemia module! Anaemia can be defined as a reduction in the haemoglobin in the blood below normal range for age and sex. Essentially, anaemia is defined as haemoglobin (Hb) concentration: For adult males < 13.5 g/dl For adult women < 11.5 g/dl Anaemia is a global public health problem affecting both developing and developed countries. It has major consequences for human health as well as social and economic development. In 2008, iron deficiency anaemia was considered to be among the most important contributing factors to the global burden of disease. Given the importance of anaemia both globally and within the UK, it is essential that any medical student or junior doctor can understand the major causes of anaemia, recognise it’s clinical features, interpret blood results and respond with appropriate management. Image above: scanning electron microscope image of red blood cells. Image left: Global WHO map of anaemia in preschool age children. please click on contents to repeat a section. please click on contents to repeat a section.
Contents 1. 1Introduction 1.2 use this module 1.3 Learning outcomes 2.1. The erythrocyte 2.2. Erythropoiesis 2.3. Red cell membrane 2.4. Haematinics 2.5. Red cell metabolism 2.6. Haemoglobin 2.7. Ageing and death Quiz 1 3.0. Defining anaemia. 3.1. Prevalence 3.1. Clinical features Quiz 2 4.0. Classifying anaemia 4.1. red cell indices. 4.2. Morphological classification 4.3. Aetiological classification 5.0. Blood film: a basic interpretation. Quiz 3. 6.0. Glossary 7.0. References Contents 1. 1Introduction 1.2 use this module 1.3 Learning outcomes 2.1. The erythrocyte 2.2. Erythropoiesis 2.3. Red cell membrane 2.4. Haematinics 2.5. Red cell metabolism 2.6. Haemoglobin 2.7. Ageing and death Quiz 1 3.0. Defining anaemia. 3.1. Prevalence 3.1. Clinical features Quiz 2 4.0. Classifying anaemia 4.1. red cell indices. 4.2. Morphological classification 4.3. Aetiological classification 5.0. Blood film: a basic interpretation. 5.1. Anaemia cards Quiz 3. 6.0. Glossary 7.0. References | how to use this module 1.2 • This self-directed learning (SDL) module has been designed for medical and other health care students. • We suggest that you start with the learning objectives and try to keep these in mind as you go through the module slide by slide, in order and at your own pace. • Complete the true/false questions as you go along to assess your learning. • You should research any issues that you are unsure about. Look in your textbooks, access the on-line resources indicated at the end of the module and discuss with your peers and teachers. • Finally, enjoy your learning! We hope that this module will be enjoyable to study and complement your learning about anaemia from other sources. please click on contents to repeat a section. please click on contents to repeat a section.
Contents 1. 1Introduction 1.2 use this module 1.3 Learning outcomes 2.1. The erythrocyte 2.2. Erythropoiesis 2.3. Red cell membrane 2.4. Haematinics 2.5. Red cell metabolism 2.6. Haemoglobin 2.7. Ageing and death Quiz 1 3.0. Defining anaemia. 3.1. Prevalence 3.1. Clinical features Quiz 2 4.0. Classifying anaemia 4.1. red cell indices. 4.2. Morphological classification 4.3. Aetiological classification 5.0. Blood film: a basic interpretation. Quiz 3. 6.0. Glossary 7.0. References Contents 1. 1Introduction 1.2 use this module 1.3 Learning outcomes 2.1. The erythrocyte 2.2. Erythropoiesis 2.3. Red cell membrane 2.4. Haematinics 2.5. Red cell metabolism 2.6. Haemoglobin 2.7. Ageing and death Quiz 1 3.0. Defining anaemia. 3.1. Prevalence 3.1. Clinical features Quiz 2 4.0. Classifying anaemia 4.1. red cell indices. 4.2. Morphological classification 4.3. Aetiological classification 5.0. Blood film: a basic interpretation. 5.1. Anaemia cards Quiz 3. 6.0. Glossary 7.0. References | how to use this module | how to use this module 1.2 KEY Information within red boxes is considered core knowledge Information within the green boxes is considered useful knowledge Information within the grey boxes is considered optional to gain a broader understanding of anaemia and its causes. These are placed along the way within this module. Based on the learning objectives, these comment boxes are aimed at highlighting the important links between the structure, physiology and life cycle of the red blood cell to the pathological processes resulting in anaemia. Key point! These cards are designed to provide some essential information on key anaemias. These are accessible throughout the module. Anaemia essential bites. please click on contents to repeat a section. please click on contents to repeat a section.
Contents 1. 1Introduction 1.2 use this module 1.3 Learning outcomes 2.1. The erythrocyte 2.2. Erythropoiesis 2.3. Red cell membrane 2.4. Haematinics 2.5. Red cell metabolism 2.6. Haemoglobin 2.7. Ageing and death Quiz 1 3.0. Defining anaemia. 3.1. Prevalence 3.1. Clinical features Quiz 2 4.0. Classifying anaemia 4.1. red cell indices. 4.2. Morphological classification 4.3. Aetiological classification 5.0. Blood film: a basic interpretation. Quiz 3. 6.0. Glossary 7.0. References Contents 1. 1Introduction 1.2 use this module 1.3 Learning outcomes 2.1. The erythrocyte 2.2. Erythropoiesis 2.3. Red cell membrane 2.4. Haematinics 2.5. Red cell metabolism 2.6. Haemoglobin 2.7. Ageing and death Quiz 1 3.0. Defining anaemia. 3.1. Prevalence 3.1. Clinical features Quiz 2 4.0. Classifying anaemia 4.1. red cell indices. 4.2. Morphological classification 4.3. Aetiological classification 5.0. Blood film: a basic interpretation. 5.1. Anaemia cards Quiz 3. 6.0. Glossary 7.0. References | learning outcomes (L.O.) 1.3 • By the end of the module, you should be able to…. • List the key components of erythropoiesis (red cell production) • Bone marrow stroma, haemopoietic stem cells, tissue macrophages • Renal system (erythropoietin) • Functional DNA (globin genes) • Nutrition (Iron, B12, Folate, amino acids) • Link the components of red cell structure to red cell development and function • components of haemoglobin molecule • metabolic pathways active in red blood cells • features of red cell membrane • Link the classification of anaemia to the physiology of erythropoiesis and the influence of systemic pathology • Interpret red cell indices reported in a full blood count and correlate with red cell morphological classification and underlying causes of anaemia • Define anaemia and know the clinical symptoms and signs to look out for • Recognize some key blood film abnormalities please click on contents to repeat a section. please click on contents to repeat a section. L.O. We will place these objectives along the route to help direct your learning….
Contents page 2.1. The erythrocyte: an overview. | the erythrocyte: an overview 2.1 Welcome to section one. When learning about anaemia and in fact haematology in general, it is essential to go back to square one and understand the basics of cell production, function and life cycle. Within this first module we aim to tie some basic physiology of the red blood cell to the pathological manifestations of anaemia. If fully understood, it will remain as a backbone for future clinical knowledge whenever approaching an anaemic patient. With this in mind we now look in some detail at the structure, function and life cycle of the red blood cell. Please click here for next slide. An erythrocyte is a fully developed red blood cell!
Contents page | the erythrocyte: an overview 2.1 *L.O. Link the components of red cell structure to red cell development and function START HERE To achieve these functions the red cell has several unique properties…. Flexibility: the red cell is 7.8 m across and 1.7 m thick and yet it is able to fit through capillaries of only 5 m diameter. This is in-part due to the flexible membrane and shedding of the nucleus. Function The primary function of the erythrocyte is the carriage of oxygen from the lungs to the tissues and CO2 from the tissues to the lungs. The red cell also plays an important role in pH buffering of the blood. Lifespan: Because the fully developed red blood cell has no nucleus the cell cannot divide or repair itself. The lifespan is therefore relatively short (120 days). FINISH HERE Strength: it has a strong but flexible membrane able to withstand the recurrent shear forces involved in the circulation of blood. Image: scanning electron microscope of red blood cell Haemoglobin content: unique to the red cell, it is this metaloprotein molecule which is pivotal in red cell development and Oxygen transport due to its affinity for O2. Biconcave shape: increases surface area available for gaseous exchange.
Contents page 2.1. The erythrocyte: an overview. 2.2. Erythropoiesis | Erythropoiesis 2.2 An erythrocyte is a fully developed, mature red blood cell. The adult human makes approximately 1012 new erythrocytes every day by the process of erythropoiesis. This is a complex process that occurs within the bone marrow. Before an erythrocyte arrives fully functioning into the blood stream it must develop from a stem cell through an important number of stages. This module has simplified this process and highlights the key stages. Follow the numbered red boxes through to the end before continuing to the next slide. Macrophages surround and supply iron to these erythroprogenitor cells that become erythroblastic islands. As with much human physiology, this system works via a feedback mechanism. 3. EPO continues to stimulate primitive erythroid cells (red blood cells) in the bone marrow and induce maturation. Erythroid precursors Bone marrow Stem cells Red blood cells in circulation 2. EPO stimulates stem cells within the bone marrow which differentiate into erythroid precursors. erythropoietin Kidney FINISH HERE START HERE 1: Erythropoietin (EPO), a growth factor, is synthesized primarily (90%) from peritubular cells of the kidneys (renal cortex). 4. There is no store of EPO. The production of erythropoietin is triggered by tissue hypoxia (oxygen tension sensed within the tubules of the kidney) and stops when oxygen levels are normal. • List the key components of erythropoiesis (red cell production) LO
Contents page 2.1. The erythrocyte: an overview. 2.2. Erythropoiesis | 2.2. Erythropoiesis 2.2 Hypoxia is the major stimulant for increased EPO production Chronic renal disease / bilateral nephrectomy will reduce or stop the production of EPO. It’s absence or reduction causes anaemia through reduced red cell production. Anaemia due to EPO deficiency will be normocytic in morphology; i.e. the red cell will be a normal shape and size but reduced in number. Key point! Erythroid precursors Erythroid precursors Stem cells Stem cells Bone marrow Bone marrow erythropoietin erythropoietin Kidney Kidney In chronic states of anaemia the opposite may occur. The chronic hypoxic state increases production of EPO. This leads to an increase in the proportion of erythroblasts, expansion and eventually fatty deposition within the bone marrow. During childhood when the growth plates are still present, this expansion can lead to bone deformities such as frontal bossing. This is seen in chronic haemolysis such as thalassaemia. Key point!
Contents page 2.1. The erythrocyte: an overview. 2.2. Erythropoiesis |Red cell precursors and the sequence of erythropoiesis 2.2 Pronormoblast: This is the earliest and largest cell with a large nucleus and no haemoglobin. Reticulocytes are an important cell in haematology as they increase in number following a haemorrhage, haemolytic anaemia or from treatment of a haematinic deficiency. They provide an excellent measure of red cell production and the age of the red cell population. In normal blood there is usually about 1 reticulocyte : 100 erythrocytes. Key point! Normoblasts: these cells go through a large number of progressive changes. Fundamentally they reduce in cell size but increase the haemoglobin concentration in the cytoplasm. The nucleus proportionally decreases until it is extruded before the cell is released in to the blood. marrow Key point! Anaemia of chronic disease. In individuals living with a chronic disease (e.g. rheumatoid arthritis),a complex interaction of inflammatory cytokines interferes with the red cell lifecycle by impairing iron metabolism and inhibiting red cell precursors. The end result is a normocytic anaemia. 3.4. Reticulocytes: Considered the “teenagers” of the the life cycle! This is the FINAL stage of development before full maturation. These cells are now anucleate and contain roughly 25% of the final haemoglobin total. They reside mostly in the marrow but in healthy individuals a small number can be found in the peripheral blood. They contain some cell organelles. 3.5 Erythrocyte: after 1 week the mature erythrocyte emerges with no organelles and high haemoglobin content. Sequence: amplification and maturation of the erythrocyte blood
Contents page 2.1. The erythrocyte: an overview. 2.2. Erythropoiesis 2.3. The red cell membrane 2.4 Haematinics |haematinics “Check the haematinics” this is a phrase used frequently on the hospital ward! 2.4 • So what exactly are the haematinics? These are the key micronutrients that must be present if a red blood cell and its haemogoblin are to develop in a normal fashion. Erthropoiesis is also regulated by the availability of haematinics • These major micronutrients, provided in a balanced diet, are iron, vitamin B12 and folate • A deficiency in any one of these micronutrients can result in anaemia through impaired red cell production within the bone marrow • Assessing haematinic status is key to the investigation of the cause of anaemia haemoglobin deficiency; Click here see all key causes. Iron: At the centre of the haem molecule is an atom of iron which binds oxygen in a reversible manner. Haemoglobin concentration in the developing red cell is a rate limiting step for erythropoiesis. In iron deficiency, red cells undergo more divisions than normal and, as a result, are smaller (microcytic) and have a reduced haemoglobin content (hypochromic). Iron deficiency is the leading cause of anaemia worldwide. iron life cycle; Click here to see the key stages Click here to see a schematic diagram of vitamin B12 absorption Vitamin B12 (cobalamin)and folate (pteroylglutamic acid): These are key building blocks for DNA synthesis and essential for cell mitosis. DNA synthesis is reduced in all cells that are deficient in either folate or vitamin B12. The bone marrow is the factory for blood cell production. In haematinic deficiency, DNA replication is limited and hence the number of possible cell divisions is reduced leading to larger red cells being discharged into the blood i.e. less DNA, less divisions and larger cells. This leads to enlarged, misshapen cells or megaloblasts in the marrow and macrocytic red cells in the blood.
|haematinics in haemoglobin 2.4 Protoporphyrin Iron • Iron deficiency • Chronic inflammation • Malignancy Globin Haem • Chronic infections and inflammatory disorders cause chronic anaemia as a result of; • 1. slightly shortened red blood cell life span • 2. sequestration of iron in inflammatory cells called macrophages • Both procedures result in a decrease in the amount of iron available to make red blood cells. Thalassaemia Click here to return Haemoglobin
|haematinics: the normal iron cycle 2.4 Iron deficiency can be identified best by assessing the appearances of the red cells on a blood film. Iron indices in a blood sample are helpful to confirm a lack of iron. In order to interpret these indices, it is vital to understand how the body handles iron ….. An iron deficiency profile. Serum Iron: Reduced Serum total iron-binding capacity (TIBC): Increased- the body works hard to bind free iron. Serum ferritin: Reduced-since iron stores are low Serum soluble transferrin receptors: Increased-since red cells attempt to absorb more iron. Iron is a key constituent of haemoglobin (60-70% of total body iron is stored here) and it’s availability is essential for erythropoiesis. In iron deficiency, there are more divisions of red cells during erythropoiesis than normal. As a result the red cells are smaller (microcytic) and have a reduced haemoglobin content (hypochromic). Soluble transferrin receptors, sTfR are on the red cell surface. These can be measured and are increased in iron deficiency. Serum transferrin Fe In iron deficient states, bone marrow iron is reduced. Red blood cells Erythroid bone marrow (normoblasts) Some iron binds to apoferritin to form ferritin, a storage compound. Reticuloendothelial system; Spleen & macrophages 3. Dying red cells are recycled by macrophages in the spleen and iron is recycled into the plasma for further use. 2. Iron is then attached to a protein, transferrin in the serum (plasma), where it is transported to the bone marrow for haemoglobin synthesis. Liver 1. Iron is absorbed from the small intestine in the ferrous state (Fe2+; approx. 1mg/day). Duodenum Click here to return START
|haematinics: vitamin B12 2.4 There are a number of key steps in the absorption of Vitamin B12. The two key locations are the stomach and the terminal ilium. Dietary vitamin B12 binds with intrinsic factor (IF) in the stomach, a transport protein produced by gastric parietal cells. The B12-IF complex then travels through the small intestine and is absorbed by special receptors in the distal ileum. This pathway is important when considering possible causes of Vitamin B12 deficiency. Vitamin B12 deficiency can take up to two years to develop as the body has sufficient stores for this period. • Causes of vitamin B12 deficiency • Pernicious anaemia • Inadequate intake • Poor absorption Oesophagus Vitamin B12 ingested Pernicious anaemia: the leading cause of B12 deficiency. IgG autoantibodies target gastric parietal cells and its product IF causing an atrophic gastritis. This results in reduced secretion of intrinsic factor and therefore reduced B12-IF complex for absorption in the distal ileum. Stomach IF Intrinsic factor Distal ileum Site of B12 absorption Click here to return
Contents page 2.1. The erythrocyte: an overview. 2.2. Erythropoiesis 2.3. The red cell membrane | the red cell structure 2.3 2.1 LO • Link the components of red cell structure to red cell development and function The red cell possesses an outer lipid bilayermembrane and a cytoskeleton that consists of a dense but collapsible lattice of specialised proteins. The lipid bilayer acts as a hydrophobic skin, whereas the proteins provide the strength, deformability and the biconcave shape of the cell. There are 4 red cells proteins of importance: ankyrin spectrin actin Protein 4.1 Inherited disorders of erythrocyte membrane proteins result in a poorly deformable cell of normal size (normocyte) that cannot withstand the shear forces within the circulation. The membrane is then lost within the microcirculation creating spherical or elliptoid cells. These cells are then trapped and destroyed by macrophages within the spleen. This is one cause of haemolytic anaemia. Important examples are hereditary spherocytosis or elliptocytosis due to defects in the protein spectrin. Key point! Click next slide to see flow diagram
flow diagram: the process of spherocytosis in hereditary spherocytosis abnormal spectrin gene dysfunctional spectrin reduced spectrin synthesis Spectrin malfunction within erythrocyte membrane Erythrocytes are exposed to high sheer forces within the microcirculation Cytoskeleton function impaired; cell loses ability to deform Spherocyte: a small, more rigid, spherical erythrocyte results Cells are either destroyed within the microcirculation or detected and removed by the reticuloendothelial system of the spleen Haemolysis; premature red cell death occurs causing anaemia
Contents page 2.1. The erythrocyte: an overview. 2.2. Erythropoiesis 2.3. The red cell structure 2.3.1. Cell membrane 2.3.2. DNA synthesis 2.4. Red cell metabolism Key point: Oxidant stress! CLICK HERE |red cell metabolism H2O O- 2.5 GSSG Embden-Meyerhof glycolytic pathway 2GSH Hexose monophosphate shunt. Red cells require a mechanism to detoxify the waste products (accumulated oxidised substrates) of the cell. This shunt provides this solution. It also provides 10% of glycolysis. However this metabolic pathway is also susceptible to pathology. Glucose NADPH+H+ NAPD Glucose- 6-P 6-PG Glucose-6-phosphate dehydrogenase ADP ATP Ribulose 5-P This is a sequence of biochemical reactions in which glucose is metabolised to lactate with the generation of 2 ATP molecules (providing energy for the cell). The glycolytic pathway With no cell organelles and no mitochondria the fully developed erythrocyte relies on this aerobic pathway to gain energy (ATP) for the cell. Fructose-6-P ADP Pyruvate kinase Hexose monophosphate shunt ATP Lactate Pyruvate kinase deficiency: In rare circumstances there are defects within the critical glycolytic enzymes. 95% of these defects are associated with pyruvate kinase, a key enzyme within this pathway. The result is insufficient ATP production for cell life and therefore premature death (haemolysis). Glucose-6-phosphate dehydrogenase (G6PD) deficiency is an X-linked disorder that is relatively common. The G6PD enzyme is a rate-limiting step within this pathway. If deficient, haemolysis occurs when the cell is placed under oxidative stress (e.g. by oxidative drugs, fava beans, infections) creating a potentially severe anaemia. Click OXIDATIVE STRESS for more info. Key point!
Red cell functioning adequately under normal conditions Drugs: e.g. antimalarials Oxidant stress! Infection Fava beans H2O O- GSSG Embden-Meyerhof glycolytic pathway 2GSH Glucose Red cell cannot produce enough NADPH via the HMP shunt NADPH+H+ NAPD Glucose- 6-P 6-PG Inadequate amounts of GSH to combat oxidant stress Glucose-6-phosphate dehydrogenase ADP ATP Ribulose 5-P Oxidant damage to cell membrane Fructose-6-P ADP Pyruvate kinase Hexose monophosphate shunt ATP Reduced red cell survival Lactate Haemolytic anaemia! RETURN
Contents page 2.1. The erythrocyte: an overview. 2.2. Erythropoiesis 2.3. The red cell structure 2.3.1. Cell membrane 2.3.2. DNA synthesis 2.4. Red cell metabolism 2.5. Haemoglobin and O2 transport | haemoglobin and O2 transport 2.6 A key function of a red cell is to carry and deliver oxygen to the tissues and return CO2 from the tissues to the lungs. As a result the red cell has developed a specialised molecule called haemoglobin (Hb). It is important to gain a basic understanding of its synthesis, functioning and metabolism as errors in these processes lead to a number of anaemic states. It’s waste products are also released when a red cell is destroyed prematurely and are therefore a valuable indicator of haemolysis. A molecule called 2,3 – Diphosphoglycerate (2,3-DPG) sits between the chains and when increased helps to offload oxygen to the tissues. Oxygen (O2) 2,3-DPG GLOBIN CHAIN A normal adult haemoglobin (Hb A) molecule consists of 4 polypeptide (globin) chains: 1212. For more information on foetal haemoglobin click here oxyhaemoglobin deoxyhaemoglobin HAEM MOLECULE Each individual globin combines with one haem molecule. This molecule contains iron and binds oxygen in a reversible manner. A mature red cell (an erythrocyte) contains approximately 640 million haemoglobin molecules. Haemoglobinopathies Thalassaemia: reduced rate of synthesis of either or globin chains. Within this group of inherited conditions there may be both ineffective erythropoiesis and haemolysis resulting in a microcytic anaemia sometime also with hypochromia. Sickle cell disease: an inheritance of two abnormal -globin genes (HbSS). The abnormality consists of a point mutation in the globin gene. This results in Hb insolubility in it’s deoxygenated state with crystallization within the red cell causing sickling of the cell and vascular occlusion. A common problem that affects primarily the Afro-Caribbean populations. Key point!
| haemoglobin in foetal haemoglobin 2.6 RETURN 2,3-DPG oxyhaemoglobin deoxyhaemoglobin Oxygen requirements differ at different stages of development. The foetus displays a different type of haemoglobin to an adult. Foetal Hb (Hb F) and HbA2 still contain two chains but instead of chains have two and chains respectively. HbF has a higher affinity for oxygen compared to maternal HbA. This is impart due to less binding of 2,3 –DPG. The change from HbF to HbA occurs at around 3-6months of age.
Contents page 2.1. The erythrocyte: an overview. 2.2. Erythropoiesis 2.3. The red cell structure 2.3.1. Cell membrane 2.3.2. DNA synthesis 2.4. Red cell metabolism 2.5. Haemoglobin and O2 transport |haemoglobin and the oxygen dissociation curve 2.6 • CO2 • pH • 2,3-DPG The sigmoid curve: this occurs because as O2 is unloaded the beta chains are pulled apart and 2,3-DPG enters the space. This reduces the haemoglobin molecule’s affinity for O2. The shape of this classic sigmoid curve will be dictated by the number of 2,3-DPG metabolites and CO2 and H+ ion concentration in the red blood cell. Hb saturation (100%) 50 • CO2 • pH • 2,3-DPG A shift to the right indicates a decreased affinity for O2. This occurs when there are raised concentrations of 2,3-DPG, H+ ions (acidosis) or CO2 within the red blood cell. This results in greater release of O2 to the tissues. A shift to the left indicates an increased affinity for O2. This makes it easier for Hb to bind to O2, in the lungs and conversely more difficult for Hb to release O2 in the tissues.. This occurs when there is a rise in pH (alkalosis), low CO2 levels and with HbF. 50 PO2 (mm Hg)
Contents 1. 1Introduction 1.2 use this module 1.3 Learning outcomes 2.1. The erythrocyte 2.2. Erythropoiesis 2.3. Red cell membrane 2.4. Haematinics 2.5. Red cell metabolism 2.6. Haemoglobin 2.7. Ageing and death Quiz 1 3.0. Defining anaemia. 3.1. Prevalence 3.1. Clinical features Quiz 2 4.0. Classifying anaemia 4.1. red cell indices. 4.2. Morphological classification 4.3. Aetiological classification 5.0. Blood film: a basic interpretation. Quiz 3. 6.0. Glossary 7.0. References |ageing and death 2.7 A red cell shows signs of deterioration and reduced glycolytic rate from around 100 days of the cell’s cycle. Without any DNA or ribosomes, the cell is unable to generate new enzymes (like pyruvate kinase or G6PD that we have been introduced to). These ageing cells are eventually identified by the reticuloendothelial system. This is a system of white blood cells that are present within the spleen, liver and lymph nodes whose main role is to phagocytose damaged or ageing cells. The tired red cells are removed and recycled by macrophages in the spleen and liver. Haemolysis: any process that shortens the red blood cell lifespan to less than 120 days. Haemolytic anaemias; This is an important group of anaemias. There are many important causes of premature red cell death resulting in anaemia and the increased products of haemolysis within the blood circulation and beyond. Normally red cell degradation and recycling is managed by the reticuloendothelial system on a daily basis without any problems. When a pathological process causes premature lysis of the red cells, the ability of the body to clear the increased number of waste products may be overloaded. The next slide demonstrates the breakdown of the products of the red blood cell. This is an important pathway to consider whenever encountering a haemolytic anaemia. please click on contents to repeat a section.
Flow diagram: products of red cell destruction. 1. LDH is a nucleic enzyme which is released on red cell destruction. The concentration of LDH is measurable from a blood sample and provides an indicator of haemolysis. • Investigating haemolysis • Lactic acid dehydrogenase (LDH) • Reticulocyte count • Bilirubin Red blood cell The protoporphyrin of haem is metabolised to the yellow pigment bilirubin, which is bound to albumin in the plasma. 2. Reticulocyte count will be elevated in response to the feedback loop during anaemia. The bone marrow increases red cell production. Reticulocytes are larger than mature red blood cells causing a rise in mean cell volume ( MCV). 3. LDH Haemoglobin Haptoglobins these proteins bind to any free haemoglobin. These proteins can become saturated in a haemolytic anaemia. Haemoglobin can then pass into the urine causing haemoglobinuria or converted to haemosiderinuria. Liver Haem Iron Globin Is metabolized to amino acids Attaches to transferrin Unconjugated bilirubin 3. Bilirubin Heamolysis results in excess bilirubin causing jaundice (typically lemon yellow colour ) and pigment gallstones. Stercobilinogen is excreted in the faeces F Conjugated in the liver to the diglucuronide, water-soluble form that is secreted in the bile and then converted to stercobilinogen. Some stercobilin and stercobilogen are reabsorbed from the intestine and excreted in the urine as urobilin and urobilinogen. Raised levels in the urine may indicate haemolysis.
Well done! You have come to the end of the first section. We suggest that you answer Quiz 1 to assess your learning so far. Please remember to write your answers on the mark sheet before looking at the correct answers! true / false click to check answers
Contents 1. 1Introduction 1.2 use this module 1.3 Learning outcomes 2.1. The erythrocyte 2.2. Erythropoiesis 2.3. Red cell membrane 2.4. Haematinics 2.5. Red cell metabolism 2.6. Haemoglobin 2.7. Ageing and death Quiz 1 3.0. Defining anaemia. 3.1. Prevalence 3.1. Clinical features Quiz 2 4.0. Classifying anaemia 4.1. red cell indices. 4.2. Morphological classification 4.3. Aetiological classification 5.0. Blood film: a basic interpretation. Quiz 3. 6.0. Glossary 7.0. References Contents 1. 1Introduction 1.2 use this module 1.3 Learning outcomes 2.1. The erythrocyte 2.2. Erythropoiesis 2.3. Red cell membrane 2.4. Haematinics 2.5. Red cell metabolism 2.6. Haemoglobin 2.7. Ageing and death Quiz 1 3.0. Defining anaemia. 3.1. Prevalence 3.1. Clinical features Quiz 2 4.0. Classifying anaemia 4.1. red cell indices. 4.2. Morphological classification 4.3. Aetiological classification 5.0. Blood film: a basic interpretation. 5.1. Anaemia cards Quiz 3. 6.0. Glossary 7.0. References Welcome to section 2! | defining anaemia • What exactly is anaemia? • Anaemia is defined as haemoglobin concentration less than the normal reference range. Reference ranges differ according to age, sex and altitude. However, in general, anaemia is defined as Hb concentration • For adult males < 13.5 g/dl • For adult women < 11.5 g/dl • As well as reduced [Hb], anaemia is usually accompanied by a reduction in the number of red cells (red cell count) and packed cell volume (PCV). However this is not always the case. Red cell count and PCV may be normal in some patients with lower than normal haemoglobin levels (and hence anaemic). The total circulating haemoglobin concentration is therefore determined by…. • the circulating plasma volume • the total circulating haemoglobin mass. • The following circumstances should therefore be taken in to consideration…… | Acute significant blood loss | Following acute blood loss it may take up to a day for the plasma volume to be replaced and anaemia to present. Therefore, clinical features of shock and reduced blood volume may occur before a fall in haemoglobin concentration. | Pregnancy or splenomegaly | These can produce an increase in plasma volume reducing the apparent haemoglobin concentration even though circulating haemoglobin levels are normal. | Dehydration | Reduced plasma volume may mask anaemia. please click on contents to repeat a section. please click on contents to repeat a section.
Contents 1. 1Introduction 1.2 use this module 1.3 Learning outcomes 2.1. The erythrocyte 2.2. Erythropoiesis 2.3. Red cell membrane 2.4. Haematinics 2.5. Red cell metabolism 2.6. Haemoglobin 2.7. Ageing and death Quiz 1 3.0. Defining anaemia. 3.1. Prevalence 3.1. Clinical features Quiz 2 4.0. Classifying anaemia 4.1. red cell indices. 4.2. Morphological classification 4.3. Aetiological classification 5.0. Blood film: a basic interpretation. Quiz 3. 6.0. Glossary 7.0. References | prevalence Anaemia is thought to affect 1.62 billion people on a daily basis (WHO); this is 24% of the world’s population. Anaemia affects both developing and developed nations. However the main causes vary according to geographical region and from country to country. The WHO (World Health Organisation) has devised the most comprehensive global data bank on anaemia. Women (both pregnant and non-pregnant) and children suffer most from the condition. Developing nations A complex interaction of socio-economic conditions, nutritional deficiencies and co-existing disease (malaria, HIV) are key contributors to anaemia in developing nations (particularly within the tropics). Africa has the highest prevalence of anaemia. It occurs in 67.6% of preschool children, 57.1% of pregnant women and 47.5% of non-pregnant women. Click here to see WHO world map of the prevalence of anaemia in pre-school aged children Click here to see WHO world map of the prevalence anaemia in non-pregnant women Click here to see WHO world map of the prevalence of anaemia in pregnant women. please click on contents to repeat a section.
Contents 1. 1Introduction 1.2 use this module 1.3 Learning outcomes 2.1. The erythrocyte 2.2. Erythropoiesis 2.3. Red cell membrane 2.4. Haematinics 2.5. Red cell metabolism 2.6. Haemoglobin 2.7. Ageing and death Quiz 1 3.0. Defining anaemia. 3.1. Prevalence 3.1. Clinical features Quiz 2 4.0. Classifying anaemia 4.1. red cell indices. 4.2. Morphological classification 4.3. Aetiological classification 5.0. Blood film: a basic interpretation. Quiz 3. 6.0. Glossary 7.0. References |clinical features of anaemia Tissue hypoxia is the end result of the blood’s reduced oxygen carrying capacity. The compensatory mechanisms in response to hypoxia cause the clinical manifestations to develop. An anaemic individual will have the following two key compensatory mechanisms; 1. The cardiovascular system Cardiac compensation is the major adaptation. Both stroke volume and heart rate increase mobilizing greater volumes of oxygenated blood to the tissues. This can present with palpitations, tachycardia and heart murmurs. Dyspnoea which occurs in severely anaemic patients may be a sign of cardio-respiratory failure. 2. The skin A common sign is generalised pallor due primarily to vasoconstriction with redistribution of blood to key areas (brain, myocardium). please click on contents to repeat a section.
|clinical features of anaemia In general, a healthy individual may compensate well for anaemia and remain mostly asymptomatic. However many of the following symptoms and signs are observable when the following occurs; • A rapid onset: Anaemia that develops over a short period of time will cause more symptoms than more slowly progressing anaemia because there is less time for the O2 dissociation curve of haemoglobin and the cardiovascular system to adapt. • Severity: Mild anaemia (Hb 9.0-11.0 g/dL) often produces no symptoms or signs. In a young person, severe anaemia may not even present clinically. However this is notoriously unreliable and some patients with severe anaemia may compensate well while others with mild anaemia may present with severe symptoms. • Age: The elderly are less tolerable of anaemia mainly as a result of an inability to increase cardiac output. • Co-existent disease- often cardiac or pulmonary disease.
Contents 1. 1Introduction 1.2 use this module 1.3 Learning outcomes 2.1. The erythrocyte 2.2. Erythropoiesis 2.3. Red cell membrane 2.4. Haematinics 2.5. Red cell metabolism 2.6. Haemoglobin 2.7. Ageing and death Quiz 1 3.0. Defining anaemia. 3.1. Prevalence 3.1. Clinical features Quiz 2 4.0. Classifying anaemia 4.1. red cell indices. 4.2. Morphological classification 4.3. Aetiological classification 5.0. Blood film: a basic interpretation. Quiz 3. 6.0. Glossary 7.0. References | clinical features of anaemia General symptoms and signs Click images for explanation of signs! General Signs General Symptoms Some specific signs Headaches Shortness of breath: particularly on exercise. Palpitations Confusion and symptoms of cardiac failure in elderly Weakness and lethargy please click on contents to repeat a section.
| clinical features of anaemia This is a list of general symptoms and signs; we will cover more specific clinical features as we progress through the module. Signs: RETURN Pallor of mucous membranes (most common sign). This is a general sign. Beware: pallor is quite subjective and NOT a reliable clinical sign. Be careful not to exclude anaemia on the basis of absence of pallor alone
| clinical features of anaemia This is a list of general symptoms and signs; we will cover more specific clinical features as we progress through the module. Signs: RETURN Nail bed; demonstrating koilonychia (spoon-shaped nails). This is specific to iron deficiency.
| clinical features of anaemia This is a list of general symptoms and signs; we will cover more specific clinical features as we progress through the module. Signs Atrophic glossitis; red large swollen tongue. This is seen in both vitamin B12 and folate deficiency. RETURN
| clinical features of anaemia This is a list of general symptoms and signs; we will cover more specific clinical features as we progress through the module. Signs Angular stomitis; fissuring at corners of mouth. This is seen in both vitamin B12 and folate deficiency. RETURN
| clinical features of anaemia This is a list of general symptoms and signs; we will cover more specific clinical features as we progress through the module. Signs Dysphagia: pharyngeal web (Paterson-Kelly syndrome). This occurs in iron deficiency. RETURN
| clinical features of anaemia This is a list of general symptoms and signs; we will cover more specific clinical features as we progress through the module. Signs Peripheral oedema. A general sign. RETURN
| clinical features of anaemia This is a list of general symptoms and signs; we will cover more specific clinical features as we progress through the module. Signs High flow murmur, bounding pulse and/or tachycardia: All features of a compensatory hyperdynamic circulation. These are general signs! RETURN
Contents 1. 1Introduction 1.2 use this module 1.3 Learning outcomes 2.1. The erythrocyte 2.2. Erythropoiesis 2.3. Red cell membrane 2.4. Haematinics 2.5. Red cell metabolism 2.6. Haemoglobin 2.7. Ageing and death Quiz 1 3.0. Defining anaemia. 3.1. Prevalence 3.1. Clinical features Quiz 2 4.0. Classifying anaemia 4.1. red cell indices. 4.2. Morphological classification 4.3. Aetiological classification 5.0. Blood film: a basic interpretation. Quiz 3. 6.0. Glossary 7.0. References Contents 1. 1Introduction 1.2 use this module 1.3 Learning outcomes 2.1. The erythrocyte 2.2. Erythropoiesis 2.3. Red cell membrane 2.4. Haematinics 2.5. Red cell metabolism 2.6. Haemoglobin 2.7. Ageing and death Quiz 1 3.0. Defining anaemia. 3.1. Prevalence 3.1. Clinical features Quiz 2 4.0. Classifying anaemia 4.1. red cell indices. 4.2. Morphological classification 4.3. Aetiological classification 5.0. Blood film: a basic interpretation. 5.1. Anaemia cards Quiz 3. 6.0. Glossary 7.0. References Well done! You have come to the end of the second section. We suggest that you answer Quiz 2 to assess your learning so far. Please remember to write your answers on the mark sheet before looking at the correct answers! true / false click to check answers please click on contents to repeat a section. please click on contents to repeat a section.
Contents 1. 1Introduction 1.2 use this module 1.3 Learning outcomes 2.1. The erythrocyte 2.2. Erythropoiesis 2.3. Red cell membrane 2.4. Haematinics 2.5. Red cell metabolism 2.6. Haemoglobin 2.7. Ageing and death Quiz 1 3.0. Defining anaemia. 3.1. Prevalence 3.1. Clinical features Quiz 2 4.0. Classifying anaemia 4.1. red cell indices. 4.2. Morphological classification 4.3. Aetiological classification 5.0. Blood film: a basic interpretation. Quiz 3. 6.0. Glossary 7.0. References Welcome to section 3!|classification of anaemia Essentially there are two ways to classify anaemia, by red cell size (morphological classification) or by cause (aetiological classification). Both have their purpose and both need to be fully understood to gain a rounded understanding of anaemia. Morphological classification This is a practical and clinically useful classification for establishing a differential diagnosis of anaemia. It is done by examining red cells in a blood stained smear and by automated measurements of red cell indices Aetiological classification This classification is based on cause and illuminates the pathological process underlying anaemia. *Key point: In order to understand this classification it is essential to understand red cell indices reported in the full blood count (FBC). There is great reward in understanding these indices as they enable one to identify some of the underlying processes leading to anaemia and, importantly, help to formulate a differential diagnoses. please click on contents to repeat a section.
|red cell indices These are the key measures of red cell indices. They relate to the haemoglobin content and size of the red blood cells. • MCV: Mean cell volume; the average volume of the red cells. MCV does not provide an indicator of either haemoglobin concentration within the cells, or the number of red cells. It enables us to categorize red cells into the following; • Microcytic(MCV <80fL) a small red blood cell. • Normocytic (MCV of 80-99fL) a normal size red blood cell. • Macrocytic(MCV > 99fL) a large red blood cell. • This is a key index that is used daily in medical settings across the world to categorize the type of anaemia present. • It is reliable in most cases; one exception is when two pathologies occur at the same time such as vitamin B12 and Iron deficiency. MCV reports average cell volume; further assessment of cell size and how this varies within an individual can be ascertained from the red cell distribution width (RDW; see below). MCH: Mean corpuscular haemoglobin ( normal range 26.7-32.5pg/cell): the average haemoglobin content of red blood cells. Cells with a reduced haemoglobin content are termed hypochromic and those with a normal level are termed normochromic (see below). RDW: Red cell distribution width; an index of the variation in sizes of the red cell population within an indiviual. This will be raised if two red cell populations are present. Occasionally useful if there is doubt about multiple causes of anaemia. A common cause for an increased RDW is the presence of reticulocytes. Normochromic implies normal staining of the cells in a thin blood film. The central area of pallor is normally about 1/3 of the cell diameter Hypochromic indicates reduced staining with increase in the central area of pallor
|interpretation of red cell indices Normocytosis & normochromia Microcytosis & hypochromia Macrocytosis & megaloblastosis Microcytic abnormally small red blood cells.Microcytic anemia is not caused by reduced DNA synthesis. It is not fully understood but is believed to be due reduced erythroid regeneration. Normocytic normochromic anaemia develops when there is a decrease in the production of normal red blood cells. Macrocytic megaloblastic red blood cells have an unusual misshapen appearance, which is due to defective synthesis of DNA. This in turn leads to delayed maturation of the nucleus compared to that of the cytoplasm and the cells have a reduced survival time. Hypochromic hypochromic cells due to a failure of haemoglobin synthesis. Normocytic Many processes causing anaemia do not effect the cell size or haemoglobin concentration within cells. In clinical practice megaloblastic anaemia is almost always caused by a deficiency of vitamin B12 or folate which are key building blocks in DNA synthesis. • Pathologies; • anemia of chronic disease (some) • aplastic anemia • Haemolysis: a increased destruction (some) • Hemolysis ;or loss of red blood • pregnancy/fluid overload: an inbalance or an increase in plasma volume compared to red cell production • Pathologies; • Iron deficiency; iron is an essential building block of haem. • Failure of globin synthesis; this occurs in the thalassemia's. • Crystallization of haemoglobin: sickle cell disease and haemoglobin C. Macrocytosis: The exact cause of the pathological mechanisms behind these large cells is not fully understood.. It is thought to be linked to lipid deposition on the red cell membrane. Alcohol is the most frequent cause of a raised MCV! Alcohol | Liver disease | hypothyroidism | Hypoxia | cytotoxic drugs | pregnancy |
Contents 1. 1Introduction 1.2 use this module 1.3 Learning outcomes 2.1. The erythrocyte 2.2. Erythropoiesis 2.3. Red cell membrane 2.4. Haematinics 2.5. Red cell metabolism 2.6. Haemoglobin 2.7. Ageing and death Quiz 1 3.0. Defining anaemia. 3.1. Prevalence 3.1. Clinical features Quiz 2 4.0. Classifying anaemia 4.1. red cell indices. 4.2. Morphological classification 4.3. Aetiological classification 5.0. Blood film: a basic interpretation. Quiz 3. 6.0. Glossary 7.0. References | morphological classification of anaemia Normocytic normochromic Macrocytic Anaemia type Microcytic hypochromic Megaloblastic Red cell indices normal MCV < 80 fl MCH < 27 pg/L MCV > 98 fl Folate deficiency B12deficiency Iron deficiency Thalassaemia Sideroblastic • Haemolysis • Chronic disease • Marrow infiltration Common examples please click on contents to repeat a section.
Contents 1. 1Introduction 1.2 use this module 1.3 Learning outcomes 2.1. The erythrocyte 2.2. Erythropoiesis 2.3. Red cell membrane 2.4. Haematinics 2.5. Red cell metabolism 2.6. Haemoglobin 2.7. Ageing and death Quiz 1 3.0. Defining anaemia. 3.1. Prevalence 3.1. Clinical features Quiz 2 4.0. Classifying anaemia 4.1. red cell indices. 4.2. Morphological classification 4.3. Aetiological classification 5.0. Blood film: a basic interpretation. Quiz 3. 6.0. Glossary 7.0. References |aetiological classification of anaemia • This classification is based on cause and illuminates the pathogenic process leading to anaemia. • You can look at anaemia from a production,destruction or pooling point of view. • Reduced Production • Insufficient production: If you consider the bone marrow to be the factory it must have enough raw material (Iron, vitamin B12 and folate) to make new blood cells. These raw material are called haematinics. If there is not enough of the raw material (a deficiency of one or more of the haematinics), then there is insufficient production. • Inefficient production (erythropoiesis): some problem with maturation of the erythroid in the marrow. Occurs in bone marrow infiltration (malignancy/leukaemia), aplastic anaemia or in the macrocytic megaloblastic anaemia. • Destruction • Reduced Cell lifespan • This is either due to loss of red blood cells in a haemorrhage (a bleed) or the excessive destruction of red blood cells in haemolysis. Haemolysis is an important cause of red cell destruction and anaemia. • Pooling: Hypersplenism. please click on contents to repeat a section.
Contents 1. 1Introduction 1.2 use this module 1.3 Learning outcomes 2.1. The erythrocyte 2.2. Erythropoiesis 2.3. Red cell membrane 2.4. Haematinics 2.5. Red cell metabolism 2.6. Haemoglobin 2.7. Ageing and death Quiz 1 3.0. Defining anaemia. 3.1. Prevalence 3.1. Clinical features Quiz 2 4.0. Classifying anaemia 4.1. red cell indices. 4.2. Morphological classification 4.3. Aetiological classification 5.0. Blood film: a basic interpretation. Quiz 3. 6.0. Glossary 7.0. References |classification of anaemia based on pathology |classification of anaemia based on pathology anaemia Loss of red cells due to bleeding Dilution of red cells by increased plasma volume (e.g. hypersplenism) Failure of production of red cells by the bone marrow Increased destruction of red cells (haemolytic anaemia • Ineffective red cell formation • Chronic inflam. • Thalassaemia • renal disease • Reduced bone marrow erythroid cells • aplastic anaemia • Leukaemia or malignancy • Nutritional (haematinic) deficiency • Iron • vitamin B12 • folate Inherited / inside the cell Acquired / outside cell Abnormal red cell membrane Abnormal haemoglobin Abnormal red cell metabolism immune Non-immune • Malaria • Burns • Mechanical heart valve • Hypersplenism • PNH • Autoimmune warm • Autoimmune cold • Adverse drug reaction • Haemolytic disease of the newborn • Pyruvate kinase deficiency • G6PD deficiency • Thalassaemia • Sickle cell anaemia • Sperocytes • Elliptocytes please click on contents to repeat a section.
Contents 1. 1Introduction 1.2 use this module 1.3 Learning outcomes 2.1. The erythrocyte 2.2. Erythropoiesis 2.3. Red cell membrane 2.4. Haematinics 2.5. Red cell metabolism 2.6. Haemoglobin 2.7. Ageing and death Quiz 1 3.0. Defining anaemia. 3.1. Prevalence 3.1. Clinical features Quiz 2 4.0. Classifying anaemia 4.1. red cell indices. 4.2. Morphological classification 4.3. Aetiological classification 5.0. Blood film: a basic interpretation. Quiz 3. 6.0. Glossary 7.0. References |blood film: a basic interpretation A blood film is an essential investigation in classifying and diagnosing the cause of anaemia. A blood sample (anticoagulated venous sample) is smeared onto a glass slide, fixed and stained. Red cells are examined along with white cells, granulocyte precursors, blast cells and platelets. Red blood cells appear paler in the centre of the cell due to their biconcave shape. The pinkish colour one observes in a normal blood film is a result of the cells unique haemoglobin content. Shape, size and colour are the key variables to observe. Please click on each cell to see the blood film and it’s causes. Please click here to compare blood films Basket case Normal red cell Macrocyte Microcytic hypochromic Target cell Malarial parasite Tear drop poikilocyte Pencil cell Elliptocyte Fragments Spherocyte Stomatocyte Sickle cell Acanthocyte please click on contents to repeat a section.