Download
1 / 18
180 likes | 303 Views
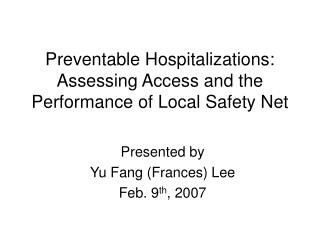
USING ADMINISTRATIVE DATA TO MONITOR ACCESS, IDENTIFY DISPARITIES, AND ASSESS PERFORMANCE OF THE SAFETY NET. John Billings September, 2003. NYU Center for Health and Public Service Research. WHAT ARE “ADMINISTRATIVE DATA”. Computerized records Gathered for some “administrative” purpose

E N D
USING ADMINISTRATIVE DATATO MONITOR ACCESS, IDENTIFY DISPARITIES, AND ASSESS PERFORMANCEOF THE SAFETY NET John Billings September, 2003 NYU Center for Health and Public Service Research
WHAT ARE“ADMINISTRATIVE DATA” • Computerized records • Gathered for some “administrative” purpose • Bill paying/reimbursement • Record keeping • Typically containing information about individuals • Demographics • Utilization of services • Other events (birth, death, etc.)
SOME EXAMPLES OF“ADMINISTRATIVE DATA” • Birth/death records • Hospital admission/discharge abstracts • Emergency department billing records • Medicare and Medicaid claims files
ADVANTAGES OF“ADMINISTRATIVE DATA” • They’re already there • They’re electronic [computerized] • They can be relatively inexpensive to analyze [sometimes] • They can tell you a lot about what is going on [sometimes]
DISADVANTAGES OFADMINISTRATIVE DATA • They can be “dirty” (caution is required) • Some data elements are a lot better than others • A good test is whether anyone will go to jail for bad data, or there is some other good reason to get it right • They seldom tell the whole story (often raising more pesky questions) • Not everyone is willing to share (which may be required) • You’re probably going to be dealing with bureaucrats not particularly interested in being helpful
USING BIRTH RECORDSTO MONITOR BIRTH “OUTCOMES” • Late/no prenatal care • Low birth weight (adjusted for gestational age) • Preterm birth
Percent Late/No Prenatal CareNew York City1997-8 R2 = .435 Each “■ “represents zip code area Source: NYU Center for Health and Public Service Research
Coney Island Staten Island Source: NYU Center for Health and Public Service Research
USING HOSPITAL DISCHARGE DATAPreventable/Avoidable HospitalizationsAmbulatory Care Sensitive (ACS) Conditions • ACS Conditions - Where timely and effective ambulatory care help prevent the need for hospitalization • Chronic conditions – Effective care can prevent flare-ups (asthma, diabetes, congestive heart disease, etc.) • Acute conditions – Early intervention can prevent more serious progression (ENT infections, cellulitis, pneumonia, etc.) • Preventable conditions – Immunization preventable illness
ACS Admissions/1,000By Zip Code Area Income Baltimore - Age 0-17 - 1999 Adms/1,000 R2 = .595 LowInc/HiInc = 2.24 Mean Rate = 9.53 Each represents a zip code Percent of Households with Income <$15,000 Source: NYU Center for Health and Public Service Research
ACS Admissions/1,000By Zip Code Area Income Baltimore - Age 40-64 - 1999 Adms/1,000 R2 = .893 LowInc/HiInc = 4.08 Mean Rate = 26.69 Each represents a zip code Percent of Households with Income <$15,000 Source: NYU Center for Health and Public Service Research
Atlanta Metro Area ACS Admissions/1,000 Age 40-64 - 1999 Source: AHRQ/HCUP - NYU Center for Health and Public Service Research
Atlanta Metro Area ACS Admissions/1,000 Age 40-64 - 1999 Source: AHRQ/HCUP - NYU Center for Health and Public Service Research
ACS Admissions/1,000By Zip Code Area Income New York City - Age 18-64 - 2000 Adms/1,000 R2 = .613 LowInc/HiInc = 3.18 Mean Rate = 10.64 10035 Low income zip codes with large differences in ACS rates 11239 Each represents a zip code Percent of Households with Income <$15,000 Source: NYU Center for Health and Public Service Research
USING EMERGENCY DEPARTMENT DATATO MONITOR THE SAFETY NET NYU ED CLASSIFICATION ALGORITHM Not preventable/avoidable ED Care Needed Preventable/avoidable Emergent Primary Care Treatable Non-Emergent Source: NYU Center for Health and Public Service Research
Preventable/Avoidable ED Use/1,000By Zip Code Area Income Baltimore - Age 18-64 - 2000 ED Visits/1,000 R2 = .783 LowInc/HiInc = 3.77 Mean Rate = 80 Each represents a zip code Percent of Households with Income <$15,000 Source: AHRQ/HCUP - NYU Center for Health and Public Service Research
Preventable/Avoidable ED Use/1,000By Zip Code Area Income Austin Metro Area - Age 0-17 - 2000 Austin Metro Area Source: NYU Center for Health and Public Service Research
SOME CAUTIONS FOR USINGADMINISTRATIVE DATA • The data can be “dirty” (see above) • If a number is way high or way low, it’s probably wrong • Unless it’s not • (Some disparities are huge) • Don’t expect final answers • Avoid the easy explanation – this stuff is complex