Download
1 / 23
230 likes | 317 Views
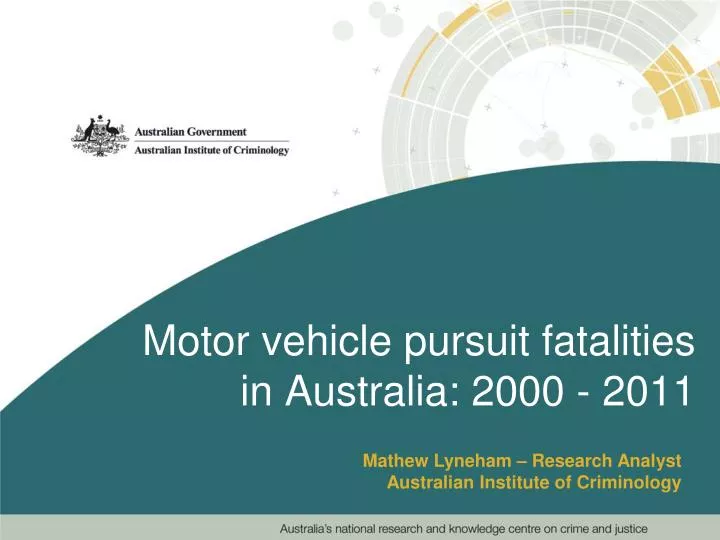
Motor vehicle pursuit fatalities in Australia: 2000 - 2011. Mathew Lyneham – Research Analyst Australian Institute of Criminology. This presentation will:.

E N D
Motor vehicle pursuit fatalitiesin Australia: 2000 - 2011 Mathew Lyneham – Research AnalystAustralian Institute of Criminology
This presentation will: • Describe the key preliminary national findings from a recent collaborative study with police services around fatal motor vehicle pursuits across Australia since 2000; • Touch on areas in need of further research.
This presentation will not: • Argue for or against motor vehicle pursuits; or • Discuss individual cases.
What does the NDICP do? • The AIC coordinates the National Deaths in • Custody Program (NDICP) • Collects information about deaths in custody (prison, juvenile detention and police cells); and • Deaths in police custody-related operations (e.g. escorting, sieges, raids, shootings, and motor vehicle pursuits).
What does the NDICP do? • Information about the circumstances and nature of deaths in custody are supplied by the relevant custodial authority, supplemented with coronial records • Works with custodial authorities to identify emerging trends and issues • Provides evidence base for reform and development of strategies to reduce deaths in custody
Why focus on motor vehicle pursuits? • Since 2000, deaths in motor vehicle pursuits represent between 45% and 66% of all deaths in police operations each year; and • Because they frequently occur on public roads, motor vehicle pursuits are more likely to affect members of the community than any other type of operational policing activity.
Research methodology: • NDICP database held information about deaths of alleged offenders in pursuits. • NCIS database held information about deaths of innocent people in pursuits. • Police agencies provided additional information and data.
How many pursuit-related deaths have occurred in Australia: 2000-2011? • 186 pursuit-related crashes resulting in 219 deaths. • 138 alleged offenders died (63%). • 81 innocent people died (37%). • Annual average of 17 crashes and 20 deaths.
Demographic characteristics • Persons less than 25 years represent 53% of all deaths in pursuits (n=116). • Persons less than 25 years represent 51% of the deaths of those driving the vehicle being pursued (n=58). • Males over-represented in both groups – 84% of all deaths, 78% of those driving the vehicle.
Precipitating offences • The offence is known in 162 of the 186 pursuit-related fatal crashes (87%). • Most prevalent offence category was ‘traffic-related offences’ such as speeding or dangerous driving (38%, n=61); followed by • Motor vehicle theft (32%, n=51) then exceed PCA (19%, n=31).
Role of drugs and/or alcohol • Abundance of literature that shows the harmful effects of drugs and/or alcohol on driving ability and increasing risk-taking behaviour. • Post-mortem toxicology results were available for 150 of the 219 deaths (68%). • Not possible to determine level of intoxication, but useful to indicate consumption prior to the incident.
Role of drugs and/or alcohol cont. • For those driving the vehicle being pursued, where toxicology results were available (n=89, 79%) - • 33% (n=28) had consumed alcohol; • 30% (n=27) had consumed drugs; and • 26% (n=23) had consumed both. • Overall, 88% had consumed alcohol, drugs or both prior to the fatal motor vehicle pursuit.
What role did speed play and how long did these fatal pursuits go for? • Not possible to determine whether these fatal pursuits are measurably different from all pursuits however, these data are useful to build a profile of such incidents. • Average speed was 129km/h and average length was 4 mins 53 seconds • Speeds ranged from 50km/h to 210km/h • Length ranged from 5 seconds to 81 mins
Average speeds reached in fatal pursuits, by year, 2000-2011 (km/h)
Average duration of fatal pursuits, by year, 2000-2011 (mins)
Was location and time of day a factor? • 69% (n=129) of the fatal pursuit-related crashes occurred in rural/remote areas; and • 31% (n=57) occurred in capital cities. • There were considerable spikes in the number of pursuit crashes during the early hours on Wednesday’s, Friday’s, Saturday’s and Sunday’s.
Distribution of pursuit-related fatal crashes across the week, by time of day (n)
How many pursuits are there each year? • Important to place the number of fatalities in the context of the number of pursuits each year • Police agencies provided data on the number of pursuits each year since 2004 • Approximately 4,000 pursuits each year • Since 2009, pursuit numbers have increased (up 10%), but fatalities have dropped (down 50%)
What is the rate of fatal pursuits? • Rates calculated by dividing number of fatal crashes by number of pursuits each year x 1,000 • Nationally, rate of fatal pursuits ranged between 2.3 per 1,000 in 2004 to a high of 4.6 per 1,000 in 2010 • Over the last seven years (2004 to 2011) between 1 in 217 and 1 in 435 pursuits ended in fatality
Summary of key findings • Young people under 25, particularly young men, are over-represented in pursuit-related fatalities; • 88% of the drivers who were being pursued had consumed an intoxicant prior to the incident; • Pursuit speeds have remained stable, but length of time has dropped considerably; and • Rate of death in pursuits fluctuated, but fairly stable
What other research is needed? • Little is known about non-fatal and ‘successful pursuits’, those that end in the arrest of the alleged offender • What is the financial cost of pursuits? • Philosophical debate – striking a balance between community expectations of the police to uphold the law, with risks to community safety of pursuing alleged offenders at high speed
What is your view? Questions?