Download
1 / 52
520 likes | 546 Views
Explore the causes and trends of lane departures, such as distracted driving and driver fatigue, on US-2 highway. Detailed crash analysis and safety audit results for roadway improvements.

E N D
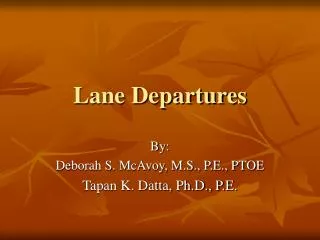
Lane Departures By: Deborah S. McAvoy, M.S., P.E., PTOE Tapan K. Datta, Ph.D., P.E.
Lane Departures • What are Lane Departures? • Vehicles leaving their designated lane • Crossing the Centerline • Leaving the Roadway • Where do Lane Departures Occur? • Low Traffic Volumes • High Travel Speeds • Rural Highways and Roadways
Lane Departures • Why do Lane Departures Occur? • Distracted Driving • Driver Fatigue • Driver Drowsiness or Falling Asleep • Driving Under the Influence
Distracted Driving • National Highway Traffic Safety Administration (NHTSA) estimates 25% of all crashes involve driver distraction • Distracted Driving • Drivers concentrate on something other than operating their vehicles
Distracted Driving • Physical Distractions • Searching for music on the radio • Changing CD’s • Talking on a cell phone • Drinking/eating • Reading while driving • Talking to passengers/children
Distracted Driving • Cognitive Distractions • Gazing out the window • Wandering thoughts • Road Rage • Aggressive mood • Boredom • Fatigue
Drowsy/Fatigued Driving • NHTSA estimates falling asleep is responsible for : • 100,000 crashes per year • 40,000 injuries per year • 1,550 fatalities per year
Drowsy/Fatigued Driving • Characteristics • Late night/early morning or mid-afternoon crashes • Crash is likely to be serious • Involves a single vehicle leaving the roadway • Crash occurs on a high-speed roadway • The driver does not attempt to avoid the crash • The driver is alone
US-2 Road Safety Audit • Sponsored by OHSP • Conducted by Wayne State University-Transportation Research Group Summer of 2005 • Limited Scope • Crash Analysis
US-2 • One of two main east-west routes in the UP • Located along the northern shore of Lake Michigan • Highly Scenic Route • Passes through several recreational areas • High percentage of Recreational Vehicles and Commercial Trucks
US-2 Project US-2 Study Area, Crystal Falls to St. Ignace
US-2 Crash Analysis • Preliminary Crash Analysis • Detailed Crash Analysis of high-crash segments • Corridor Crash Analysis • High Deer Crash Locations • Speeding Related Crash Locations • Run-off-the-Road Crash Locations
US-2 Crash Analysis • Focus Segment Crash Location Map SV = Single Vehicle Crash HO = Head-on Crash RE = Rear-end Crash
US-2 Crash Trends • Yearly Crash Trends along US-2 (2001-2003)
Monthly Variation of Crashes along US-2 (2001-2003)
Time of Day Variation of Crashes along US-2 (2001-2003) Injury and Fatal Crashes Property Damage Only – Run-off-the-Road Crashes
Light Condition Variation of Crashes along US-2 (2001-2003) Injury and Fatal Crashes Property Damage Only – Run-off-the-Road Crashes
Road Condition Variation of Crashes along US-2 (2001-2003) Injury and Fatal Crashes Property Damage Only – Run-off-the-Road Crashes
Annual Trend of Crashes along US-2 (2001-2003) Involving Drivers Under the Influence of Alcohol (1999-2003) Speeding-Related Crashes (1999-2003)
Annual Trend of Crashes along US-2 (2001-2003) Involving Unbelted Drivers (1999-2003) Deer-Related Crashes (1999-2003)
Crash Causation along US-2 • Detailed analysis of the 848 fatal crashes, injury crashes and PDO-ROR crashes (2001-2003)
Lost Control Crashes • Icy, Snowy or Slushy Road Conditions • 191 Crashes • 71.5% • Wet Road Conditions • 41 Crashes • 15.4% • Dry Road Conditions • 33 Crashes • 12.4%
Lost Control Crashes • Icy, Snowy or Slushy Road Conditions • 163 Single Vehicle ROR Crashes • 7 Type A Injury • 12 Type B Injury • 28 Type C Injury • 9 Head-On ROR Crashes • 3 Fatal Crashes • 1 Type A Injury • 1 Type B Injury • 1 Type C Injury
Lost Control Crashes • Wet Road Conditions • 32 Single Vehicle ROR Crashes • 3 Type A Injury • 7 Type C Injury • 3 Head-On ROR Crashes • 2 Type A Injury
Lost Control Crashes • Dry Road Conditions • 25 Single Vehicle ROR Crashes • 3 Type A Injury • 3 Type B Injury • 2 Type C Injury • 5 Sideswipe Crashes • 1 Type A Injury • 1 Type C Injury • 2 Head-On ROR Crashes • 1 Fatal Crash • 1 Type C Injury
Failed to Yield Crashes • Icy, Snowy or Slushy Road Conditions • 7 Crashes • 4.7% • Wet Road Conditions • 29 Crashes • 19.5% • Dry Road Conditions • 113 Crashes • 75.8%
Failed to Yield Crashes • Icy, Snowy or Slushy Road Conditions • 5 Angle (2 ROR) • 2 Type A Injury • 2 Type C Injury • 1 Rear-End • 1 Type C Injury
Failed to Yield Crashes • Wet Road Conditions • 17 Angle Crashes (7 ROR) • 1 Fatal Crash (ROR) • 4 Type A Injury • 5 Type B Injury • 4 Type C Injury • 4 Head-On Crashes (1 ROR) • 2 Type B Injury • 1 Type C Injury • 4 Rear-End Crashes (1 ROR) • 2 Type B Injury • 1 Type C Injury
Failed to Yield Crashes • Dry Road Conditions • 72 Angle Crashes (22 ROR) • 4 Fatal Crashes • 15 Type A Injury • 13 Type B Injury • 33 Type C Injury • 12 Head-on Crashes (1 ROR) • 1 Type A Injury (ROR) • 2 Type B Injury • 6 Type C Injury • 9 Single Vehicle Crashes (6 ROR ) • 2 Type B Injury • 4 Type C Injury
Unable to Stop Crashes • Icy, Snowy or Slushy Road Conditions • 17 Crashes • 13.3% • Wet Road Conditions • 40 Crashes • 31.3% • Dry Road Conditions • 71 Crashes • 55.5%
Unable to Stop Crashes • Icy, Snowy or Slushy Road Conditions • 7 Rear-End Crashes (3 ROR) • 5 Type C Injury • 4 Angle Crashes (3 ROR) • 1 Type B Injury • 1 Type C Injury
Unable to Stop Crashes • Wet Road Conditions • 32 Rear-end Crashes (6 ROR) • 5 Type B Injury • 24 Type C Injury • 5 Angle Crashes (1 ROR) • 1 Fatal Crash (ROR) • 1 Type B Injury • 3 Type C Injury • 2 Single Vehicle ROR Crashes • 1 Type A Injury
Unable to Stop Crashes • Dry Road Conditions • 54 Rear-end Crashes (3 ROR) • 3 Type A • 8 Type B • 43 Type C • 6 Single Vehicle Crashes (5 ROR) • 1 Type B • 3 Type C
Driver Fell Asleep Crashes • Icy, Snowy or Slushy Road Conditions • 3 Crashes • 4.5% • Wet Road Conditions • 14 Crashes • 20.9% • Dry Road Conditions • 49 Crashes • 73.1%
Driver Fell Asleep Crashes • Icy, Snowy or Slushy Road Conditions • 2 Single Vehicle ROR Crashes • 2 Type B Injury • 1 Sideswipe ROR Crash • 1 Type A Injury
Driver Fell Asleep Crashes • Wet Road Conditions • 13 Single Vehicle ROR Crashes • 2 Type A Injury • 2 Type B Injury • 2 Type C Injury • 1 Head-on Crash • 1 Fatal Crash
Driver Fell Asleep Crashes • Dry Road Conditions • 42 Single Vehicle Crashes (41 ROR) • 4 Type A Injury • 9 Type B Injury • 7 Type C Injury • 3 Head-on ROR Crashes • 2 Fatal Crashes • 1 Type B Injury • 1 Sideswipe-Opposite ROR Crash – Fatal Crash • 1 Angle ROR Crash – Type B Injury • 1 Rear-end Crash – Type C Injury
Driver Fell Asleep Crashes • Time of Day Crash Occurred • 6 am – 9 am • 13 Crashes • 19.4% • 9 am – 3 pm • 23 Crashes • 34.3% • 3 pm – 7 pm • 8 Crashes • 11.9% • 7 pm – 6 am • 2 Crashes • 3.0%
Distracted Driver Crashes • Icy, Snowy or Slushy Road Conditions • 6 Crashes • 10.7% • Wet Road Conditions • 7 Crashes • 12.5% • Dry Road Conditions • 43 Crashes • 76.8%
Distracted Driver Crashes • Icy, Snowy or Slushy Road Conditions • 2 Sideswipe Crashes (1 ROR) • 1 Type B Injury (ROR) • 1 Single Vehicle ROR Crash – Type C Injury • 1 Rear-end Crash – Type A Injury
Distracted Driver Crashes • Wet Road Conditions • 2 Single Vehicle ROR Crashes – PDO • 2 Rear-end Crashes (1 ROR) • Type C Injury • 1 Head-on ROR Crash – Type A Injury • 1 Angle ROR Crash – Type C Injury
Distracted Driver Crashes • Dry Road Conditions • 17 Single Vehicle Crashes (15 ROR) • 4 Type B Injury • 4 Type C Injury • 17 Rear-End Crashes (5 ROR) • 4 Type A Injury • 3 Type B Injury • 8 Type C Injury • 2 Head-on ROR Crashes • 1 Type A Injury • 1 Type C Injury • 1 Sideswipe Opposite ROR Crash – Fatal Crash
Distracted Driver Crashes • Time of Day Crash Occurred • 6 am – 9 am • 3 Crashes • 5.4% • 9 am – 3 pm • 25 Crashes • 44.6% • 3 pm – 7 pm • 15 Crashes • 26.8% • 7 pm – 9 pm • 5 Crashes • 8.9% • 9 pm – 6 am • 2 Crashes • 3.6%
Crashes to Target for Reduction • Lost Control on Dry Road Conditions • Unable to Stop on Dry Road Conditions • Driver Fell Asleep • Driver was Distracted
Potential Crash Reductions • Total Crashes • 227 Crashes in three years or 75.67 per year • Fatal Crashes • 6 in three years or 2 per year • Type A Injury Crashes • 21 in three years or 7 per year • Type B Injury Crashes • 35 in three years or 11.67 per year • Type C Injury Crashes • 76 in three years or 25.33 per year
Combating Distracted Driving • Driving safety is challenging enough when full attention is paid to roadways • It takes one distracted second for a crash to occur • Recovery on dry road conditions in fair weather conditions is possible • Recovery on icy or wet road conditions in fair weather conditions is difficult • Recovery on icy or wet road conditions in poor weather conditions is nearly impossible
Combating Distracted Driving • Shifting driver’s focus back to driving • Improving recovery area for drivers