Download
1 / 19
190 likes | 431 Views
TIMES – EE27. Markus Blesl. ETSAP semi-annual Workshop 24. November 2004 in Florence. TIMES – EE ( E uropean E lectricity Generation) 27 region model ( EU 25, N, CH)

E N D
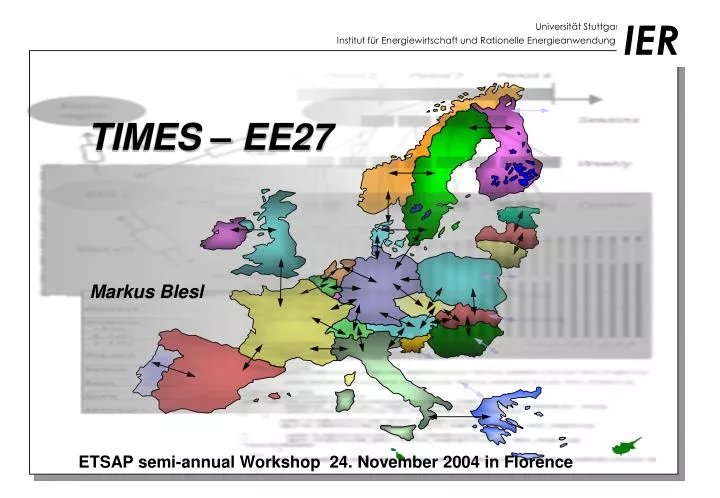
TIMES – EE27 Markus Blesl ETSAP semi-annual Workshop 24. November 2004 in Florence
TIMES – EE (European Electricity Generation) • 27 region model (EU 25, N, CH) • Detailed power generation sector (CO2 sequestration and capture options, CHP included) based on a IER power plant database with 25,000 units included • Country specific differences for characterisation of new power plants • Detailed electricity exchange balances based on ETSO statistics • Country specific load curves based on UTCE statistics • Consideration of CHP expansion options • Renewable potential (onshore wind, offshore wind, geothermal, biomass, biogas, hydro (small, middle, large)) • Country specific availability factors for renewable • Country specific heat and electricity demand reduction options • GHG: CO2, CH4, N2O included • Pollutants: NOX, SOX, particles • Time horizon 1990-2030, 5 year periods, 12 time segments per year
Model of the European Electricity market (incl. CHP) – TIMES-EE
Assumptions • Taxes included in fuel prices • Different country specific classes of prices for biomass (including different types of wood, plant wood, energy crops) and biogas depending • Country specific assumptions about the maximum / minimum of extraction capacities and use of lignite • New nuclear is possible in France, Czech Republic (after 2015), Finland, UK (on a max. constant level), Poland and Swiss
Energy price assumption on power plant level (Euro pro GJ) 6 5 4 3 Energy price on power plant level in [Euro/GJ] 2 1 0 1990 1995 2000 2005 2010 2015 2020 2025 2030 Lignite Coal Oil Gas
Energy price differences on power plant level compared with Germany (tax included) in Euro/GJ Light Fuel Heavy Fuel Oil Oil Natural Gas Steam Coal France -0,26 0,00 0,00 -0,23 Austria 0,07 -0,19 0,18 0,00 -1,30 Belgium / Lux -0,97 0,16 0,03 Switzerland -2,68 0,00 0,00 0,00 Czech Republic -0,79 -1,43 -0,18 -0,93 Denmark -1,03 0,00 0,00 0,00 Sweden -2,55 0,00 0,00 0,00 Poland -1,16 -1,30 0,00 -0,29 Netherlands 1,40 1,80 -0,74 0,00 Finland 1,56 2,32 -0,56 -0,17 -0,51 Greece 3,41 1,33 Ireland -0,05 1,22 -0,93 -0,45 Italy 3,48 0,19 -0,51 0,11 -1,30 Luxembourg 0,64 Portugal 1,39 -0,40 0,34 Spain 6,05 3,64 0,34 UK 0,46 1,54 -1,15 -0,03
or “Flexible Mechanism” Policy – CO2 target “Soft landing”
Scenario definition • Reference case (REF) • CO2 - Emission target “Soft landing” for EU15 and national targets (SOFT) • CO2 - Emission target “Soft landing” for EU27 (FLEX)
Net electricity generation by different renewable sources in EU25
Net – electricity balance for the different countries Import countries Export countries
CO2 Emission in the different scenarios in EU 15 1290 1190 1090 CO2 emission electricity and heat generation in [Mio. t CO2] 990 890 790 1990 1995 2000 2005 2010 2015 2020 2025 2030 Jahr REF SOFT FLEX Target EU15
Differences between CO2 Emission „soft landing“ and national target (buyer/seller)
Marginal cost of CO2 reduction Switch from coal to gas
Conclusions • The differences between Kyoto – target and the emissions of the electricity and heat sector are not so big. • If all European countries will include in the emission trading the certificate prices fall especially because of the hot air from Poland. • With the Kyoto – target the renewable electricity generation target for the EU25 will not be automatically achieved. • With a common electricity market, a free certificate market, a harmonised tax system the European emission reduction and the national renewable targets can be achieved in the most cost-effective manner leading to the lowest electricity prices.