Download
1 / 58
580 likes | 597 Views
Explore the shift in climate change perspectives from long-term goals to cumulative emission strategies advocated by Professor Kevin Anderson. Discover how focusing on emission accumulations rather than fixed targets transforms climate change debates, reshaping the urgency for immediate emission reduction actions and reevaluation of carbon budgets. Gain insights on the critical role of aviation and shipping emissions, implications of current emissions patterns, and necessary policy adjustments for meeting climate change challenges and ensuring a sustainable future.

E N D
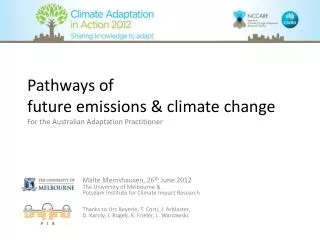
Reframing climate change: from long-term targets to emission pathways Professor Kevin AndersonDirector of the Tyndall’s Centre’s Energy Programme
Reframing Climate Change: From long-term targets to emission pathways Kevin Anderson Research director Tyndall Centre’s energy programme University of Manchester 17th June 2008 Based on research by Kevin Anderson & Alice Bows Mechanical, Aerospace and Civil Engineering
Talk outline What is dangerous climate change? Reframing the debate - cumulative emissions “It’s energy demand stupid” The critical role of aviation & shipping Responding to the challenge … the UK’s climate change bill? Revisiting the global context
What is dangerous climate change? • UK & EU define this as 2C • Links to total quantity of CO2 in atmosphere - measured in parts-per-million by volume (ppmv) • Currently 380ppmv & increasing 2-3ppmv each year - 280ppmv before industrial revolution • Still feasible to keep below 450ppmv CO2 - i.e. 70% chance of exceeding 2C 50% chance of exceeding 3C
What are the ‘correct’ emission targets for 2C ? • UK & EU have long term reduction targets - e.g. UK’s 60% reduction in CO2 by 2050 • But CO2 stays in atmosphere for approx. 100years • Hence, today’s emissions add to yesterdays & • will be added to by tomorrows • So, focus on long-term targets is very misleading
Put bluntly … the final % reduction in carbon has little relevance to avoiding dangerous climate change (e.g. 2C) What is important are the cumulative emissions of carbon
How does this scientifically-credible way of thinking, alter the challenge we face?
A bank-account analogy • We know: .. how much money we have in the bank between 2000-2050 (the carbon budget)
For a 30% chance of “avoiding dangerous climate change” the UK’s budget is ~ 4.8 billion tonnes of carbonbetween 2000-2050
From this two questions arise • What are the emissions between 2000 & today? • What emissions are we locked into in the immediate future?
Answer 1 … emissions between 2000-2006 were ~1.2 billion tonnes of carbon … i.e. we’ve used ¼ of our permitted emissions for 50 years in around 6 years!
Answer 2 Looking at this graphically …
Dip due to September 11th Plot data from 2000 to 2006
What about the next 6 years … with more aviation & shipping
But we only have 4.8 billion tonnes Carbon in the bank
… locking the UK into dramatic annual carbon reductions from around 2012-2032
… even a 550ppmv pathway has an emission reduction of ~ 6% p.a from 2015 for 2 decades
demand 2006 supply & demand
2006 11 MtC Aviation is currently 7% of UK emissions (over ½ of that from cars)
2006 11 MtC • if emissions grow at 7% until 2012 • (historical mean) • reducing to 3% from 2012-2050 Aviation is currently 7% of UK emissions (over ½ of that from cars)
2012 17MtC
2012 2030 17MtC 28MtC
2030 2012 28MtC 17MtC ~ 70% of UK emissions
What emissions pathway is implied by the climate change bill
Domestic emissions already released (ex. international aviation & shipping)
UK Domestic Carbon Emissions – Bill’s targets & pathways Climate Bill’s implied trajectory (though 26% by 2020) (though 32% by 2020) 60% reduction
UK Cumulative budget – implied by the bill Climate Bill’s implied trajectory (though 26% by 2020) Area = Cumulative carbon budget
UK Cumulative budget – implied by the bill Climate Bill’s implied trajectory (though 26% by 2020) Bill equates to ~ 6.0GtC(2000-2050) (ex. international aviation & shipping)
… adding International Aviation & Shipping UK Cumulative budget – implied by the bill Climate Bill’s implied trajectory (though 26% by 2020) Bill equates to ~ 6.0GtC(2000-2050) (ex. international aviation & shipping)
… adding International Aviation & Shipping ~1.5GtC i.e. With a low growth future for aviation & shipping (2000-2050)
Consequently, the Bill implies: • - a UK total cumulative 2000-2050 budget of ~ 7.5GtC • - an atmospheric concentration of over 650ppmv CO2 • virtual certainty of exceeding 2°C • a 50% chance of exceeding 4°C
… so what should a 2°C science-based climate change bill contain
… the bill should : • adopt cumulative emissions as basis for targets • acknowledge 2°C is much more demanding than • previously thought (~6 to 9% carbon reduction p.a.) • include aviation & shipping emissions • recognise need for immediate action on demand • (acknowledge reliance on low-carbon supply is misguided)
Tyndall’s ‘global emission scenarios (CO2e)’ • What are the latest CO2 emission trends? • What are implications of factoring in: - land-use & forestry? - non-CO2 greenhouse gas emissions? • When will global CO2e emissions peak?
What are the latest global CO2emission trends? ~ 2.7% p.a. last 100yrs ~ 3.3% p.a. in last 5 years
What are the latest global CO2eemission trends? ~ 2.8% p.a. since 2000 ~ Stern assumed 0.96%
Land-use & forestry emissions • Tyndall analysis uses • most ‘optimistic’ estimate from the literature • Tyndall very low emission scenario
Non-CO2 greenhouse gas emissions • Tyndall analysis uses • Short-term EPA estimates • Tyndall optimistic scenarios up to peak emissions • Stabilisation at low-level by 2050
When will global CO2e emissions peak? USA - 2025 Stern - 2015 Tyndall - 2015, 2020, 2025
When will global CO2e emissions peak? USA - 2025 Stern - 2015 Tyndall - 2015, 2020, 2025