Download
1 / 24
240 likes | 257 Views
Explore the UK's public spending outlook from 2011-2014, with frozen total spending and key cuts identified. Learn about various spending areas like health and education, as well as efficiency savings and their implications on different departments. Analyze the Conservative government's plans and potential gaps in spending cuts. Discover the financial intricacies of debt interest, social security, and more, impacting overall public service spending. Gain insights into the challenges and adjustments in public expenditure during this critical period.

E N D
Public spending Gemma Tetlow
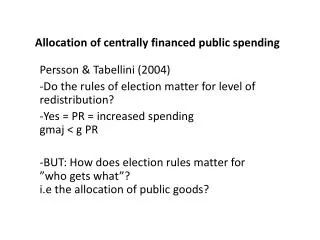
Outlook for the next spending review • Big picture: spending growth 2011–12 to 2013–14 • Total spending: frozen in real terms • Current spending: +0.8% p.a. • Investment spending: –19.2% p.a. • Spending Review 2010 period: 2011–12 to 2013–14 • Squeeze on departmental spending tighter, mostly reflects additional military spending in the “base” year • Spending in several priority areas to be ‘protected’ for first two years
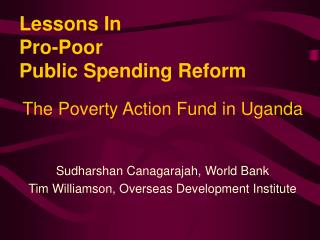
Departmental spending: When will the pain be felt? Total cut: –£35.7bn
Departmental spending: When will the pain be felt? Total cut: –£35.7bn
What cuts to departmental spending have they identified? • Total cut required by 2013–14: £35.7bn • Cuts already claimed, by 2012–13 • Efficiency savings: £11bn • Tight control of public sector pay: £3.4bn • Reforms to public sector pensions: £1bn • Cuts to lower priority budgets: £5bn • Additional cut claimed for 2013–14 • Efficiency savings: £1bn • Remaining gap? • About £15bn
Past record on efficiency savings • Spending Review 2004 period • £26.5bn efficiency savings claimed • NAO audit half-way through suggested: 25% did not adequately demonstrate true efficiencies, another 50% questionable • Comprehensive Spending Review 2007 period • £35bn efficiency savings promised • PBR 2009 confirms £8.5bn delivered by mid-2009/10 • Another £26.5bn to come before end 2010–11?
But some areas are to be ‘protected’... • Health • Real freeze in near cash NHS spending in 2011–12 and 2012–13 • Schools • 0.7% real increase in “front-line” schools spending in 2011–12 and 2012–13 • Costs an additional £0.7bn in 2012–13 • Sure Start • Real freeze in spending in 2011–12 and 2012–13 • Overseas Development Assistance • Meet 2013 target of spending 0.7% of Gross National Income • Requires average real growth of 11.3% • Additional £1.9bn by 2012–13, plus further £1.1bn in 2013–14
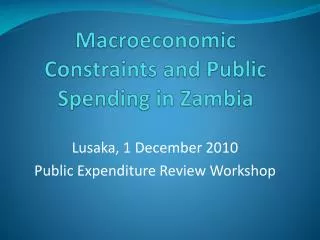
Implications for other departments? Average annual real growth: 2011–12 and 2012–13 –£22.9bn
Implications for other departments? Average annual real growth: 2011–12 and 2012–13
Implications for other departments? Average annual real growth: 2011–12 and 2012–13
Implications for other departments? Average annual real growth: 2011–12 and 2012–13
Implications for other departments? Average annual real growth: 2011–12 and 2012–13 –£25.5bn, cumulative cut 12.3%
Summary of implications for other DELs • By 2012–13: • Cuts to real DEL of £22.9bn • Pledges to increase some real spending mean additional £2.6bn must be found elsewhere • Total cuts required: £25.5bn • Any of the currently identified savings (totalling £20.4bn) that fall within protected budgets cannot contribute to the spending cut • In 2013–14: • If meet ODA target, additional cut to other DEL required: £14.0bn • Equates to further 4.0% real cut for non-ODA DEL • Additional efficiency savings identified: £1bn • Significant unprotected areas: • Defence, Higher Education, Transport and Housing
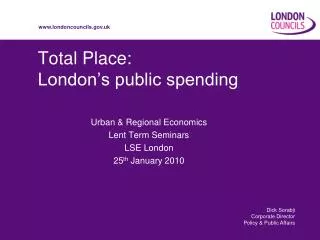
Public service spending increase in Labour’s second and third terms reversed
Where do the Conservatives plans stand? • Pledges on DEL: • Meet ODA target • Freeze NHS spending • If match Labour’s plans for total spending: • Cut required elsewhere by 2013–14: £38.8bn • Osborne’s conference speech claimed £7bn of cuts • Caveats: • Any of these found within NHS budget do not save money overall • Not all are necessarily additional to the Government’s proposals • Presumably will adopt any genuine Government efficiency savings • Remaining gap? • £10.4bn–£21.4bn
Summary (1) • Total public spending broadly flat in real terms over 2011–12 to 2013–14 • current spending to grow, deep cuts to investment spending • Under current policies some spending likely to grow • debt interest (10.7% p.a.), social security spending (1.5% p.a.) and other Annually Managed Expenditure (3.1% p.a.) • Implies cuts to central government spending on public services • Departmental Expenditure Limits could fall by 3.2% a year • £36bn lower in 2013–14 compared to 2010–11 • £15bn larger than total of efficiency savings and cuts claimed so far
Summary (2) • Over first two years 2011–12 and 2012–13 • Departmental Expenditure Limits to be cut by 3.0% a year, or £22.9bn in total • ‘Front-line’ health, schools, Sure Start and Overseas Aid pledge all ‘protected’ • other areas facing average cuts of 6.4% a year, or £25.5bn in total • severe cuts to fall elsewhere, potentially in areas such as defence, higher education, transport and housing • All of the increase in central government spending on public services over Labour’s second and third term reversed by 2013–14 • potentially first term increases also to be reversed by 2017–18
Post Pre-Budget Report briefing Institute for Fiscal Studies, 10th December 2009 www.ifs.org.uk