Download
1 / 58
580 likes | 739 Views
Handling large biological datasets Part 1. PSC Volume Browser performance issues and mouse heart analysis with the Duke CIVM. Initial PSC-VB Development during U.Michigan/NLM project. Client-Server System Architecture. vs.psc.edu is located in PSC’s machine room. www.psc.edu.

E N D
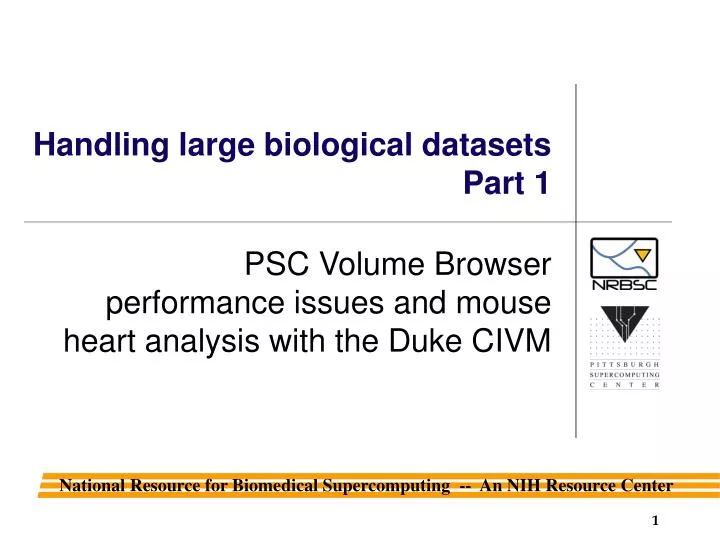
Handling large biological datasetsPart 1 PSC Volume Browser performance issues and mouse heart analysis with the Duke CIVM
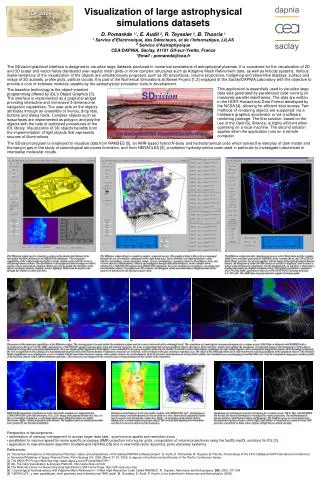
Client-Server System Architecture vs.psc.edu is located in PSC’s machine room. www.psc.edu
Implementation Issues/Design • Problems (distributing CDs to PCs): • Memory limitations • 32 bit chips only address ~2 GB of physical memory • Avoid disk seeks • IDE Disks have slow disk seeks which results in direction-dependent speeds • Maintenance of multiple image datasets with corresponding annotation • How to deal with a work in progress? • Tie into educational material • Network bottlenecks • Last mile problem, network aware…
Implementation Issues/Design Solution (Network-bound Client-Server): • Use memory-based server representations • 64 bit architecture, fast memory access • amortize additional costs across all users • Apply volumetric compression and progressive resolution techniques • Take advantage of specialized client hardware • Graphics (thank the gaming industry) • Leverage network tuning from PSC’s Web100
Relevant Technology Evolution • Storage • Disk (~4 GBytes/$, 1 TByte/drive, ~100 MB/sec/drive, ~100-200 accesses/sec • Main memory (~$40/GByte, 1-8 GBytes/CPU) • Solid state drives – very high cost • Flash drives (~1/2 cost of DRAM, 500us access, 30 MB/s bandwidth) • Computation – Moore’s law still holds • Networking – improving rapidly but by jumps • Graphics hardware – effective rates improving faster than Moore’s law and now useful for general computation but still memory limited.
Methodology items of note: • Borrowed lossless H.264 transform • Used a cooperative development strategy • Communicate release instructions on web • Evaluation team provided guidance user question forms/interviews • Demonstrated CIVM database linkage by using PSC-VB as a helper application • Tried to maintain broad applicability
The PSC - CIVM pathway • NLR is the main pathway • Provides state-of-the-art performance • RTTs have dropped from ~30 ms to 15 ms • Jitter is now < 10 ms • Center to center can reach 200 Mbits/sec • Desktop end to end > 30 Mbits/sec
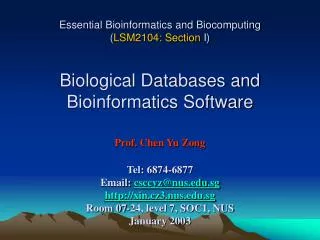
49 50 51 52 33 34 35 36 52 17 18 19 20 36 1 2 3 4 20 56 1 2 3 4 4 40 24 60 5 6 7 8 8 44 28 64 9 10 11 12 12 48 32 1 seek x 16 cubes 4 seeks x 4 cubes 16 seeks x 1 cubes 13 14 15 16 16 4 20 36 52 1 2 3 4 1 2 3 4 8 24 40 56 5 6 7 8 17 18 19 20 12 28 44 60 9 10 11 12 33 34 35 36 16 32 48 64 13 14 15 16 49 50 51 52 Impact of Disk Flat vs BlockDisk Data Format
Disk access time is more critical than network latency Cut plane FOM vs record size Multi user elevator ordering effects. Single access vs seek distance.
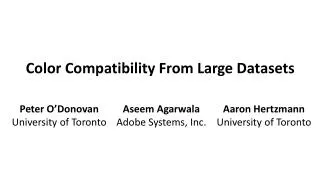
1150:1 205:1 85:1 32:1 visually lossless VM Film Hierarchical Wavelet Organization Eighth Resolution Add detail Quarter Resolution Add detail Half Resolution Add detail ~2:1 fully lossless Full Resolution
Hierarchical Normal Mesh Compression Produced by Jason McAllister
Adapting PSC-VB for mouse heart 4D volume measurement with Duke CIVM
CIVM Large Buckets of Data • Very Large 3D Arrays- MR Histology: (1k x 1k x 4k) • 4D Arrays: (3D + time) - cardiac micro-CT or MRM - perfusion micro-CT or MRM • Multimodality Data- combined micro-CT/DSA - combined micro-CT and micro-PET
Results: Pre-natal Development SE 3D sequence TR / TE = 75 / 5.23 ms Matrix = 1024 x 512 x 512 FOV = 20 x 10 x 10 mm Nex = 2 Tacq = 6 h 22 min
Mouse Project goals: • Provide technology for serving and viewing large 4D datasets • Provide secure data installation and access • Provide networked tools for 4D data visualization and analysis • Provide I2 accessible online data repository • Evaluate the effectiveness of resulting tools and techniques for usability, effectiveness and applicability to other areas.
Triggered Acquisition • -X-ray : 80 Kvp, 150 mA and 10ms(flux sufficient to fill the detector wells to ~ 25 %). Exposure 60 mR/proj • Projections acquired on1900 with a step angle of 0.750. • Scanning time about 8-10 mins
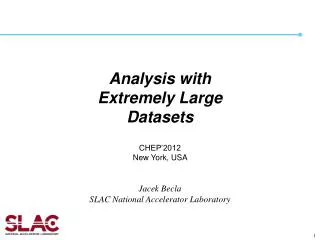
4D Cardiac Micro-CT in Mice 100x100x100 microns x 10 ms
Conventional Analysis of Cardiac Function Systole: R+ 30 ms Table1: Cardiac function estimation in (n=5) mice using the micro CT
Live Mouse Micro CT Goals • Improve accuracy of LV measurement • Reduce contrast agent dose • Reduce radiation exposure • Reduce analysis time • Reduce manual analysis intervention • Enable time studies of individual animals
MI: Hyperenhancement 5 days 35 days Nahrendorf M, Badea C, Hedlund LW, Figueiredo JL, Sosnovik DE, Johnson GA, Weissleder R. High Resolution Imaging of Murine Myocardial Infarction With Delayed Enhancement Cine Micro-CT. Am J Physiol Heart Circ Physiol. 2007 Micro-CT Study of Myocardial Infarction (MI) in Mice • MI mouse model by LAD ligation • Scanned at 5 days and 5 weeks post MI! • Goal: MI size and cardiac function
Wall Motion Analysis Cardiowarp S/w
An alternative approach to LV volume measurement • Take advantage of known binary mixture model • Avoid difficulties of segmentation methods • Account for unresolved detail and motion • Tolerate high noise levels and artifacts • Provide numerical error estimates • Trade SNR against resolution - C. Shannon 1948 • C = W log ((S+N)/N) • Use all ROI data to form a simple ratio measurement • Use measured result to constrain segmentations
MLP null C57BL/6 MICRO-CT FORMORPHOLOGICAL AND FUNCTIONAL PHENOTYPING OF MLP NULL MICE
Effects of Contrast Agent and # of CT projections 0.125 ml Contrast Agent 0.5 ml Contrast Agent 63 projections 380 projections 63 projections 380 projections
Effects of filtering and # projections over full ROIat high contrast dose
Effects of filtering and # projections over full ROIat low contrast dose
Compute volume directly from gray values FractBlood = (AvgROI – AvgMuscle) / (AvgBlood – AvgMuscle) The resulting error is small despite high voxel noise. The ROI volume is exactly known from its construction. VolumeBlood = FractBlood * VolumeROI
Histograms of isolated blood and muscle vs. contrast agent and #projections 0.125 ml contrast agent 0.5 ml contrast agent Black histograms are from 380 projections. Gray histograms are from 63 projections.