Download
1 / 37
370 likes | 488 Views
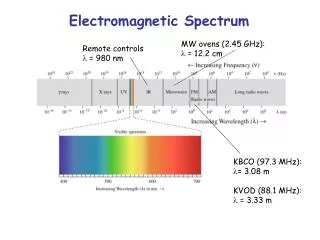
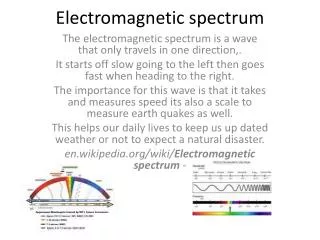
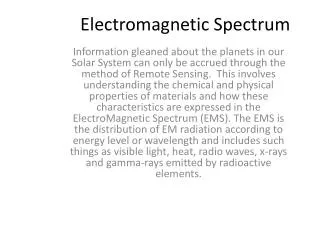
VNIR: Potential for Additional Data Collection Beyond Rapid Carbon Larry T. West National Leader Soil Survey Research and Laboratory National Soil Survey Center Lincoln, NE. Electromagnetic Spectrum. Visible / Near Infrared: 350 – 2,500 n m Mid Infrared: 2,500 – 25,000 n m

E N D
VNIR: Potential for Additional Data Collection Beyond Rapid CarbonLarry T. WestNational Leader Soil Survey Research and LaboratoryNational Soil Survey CenterLincoln, NE
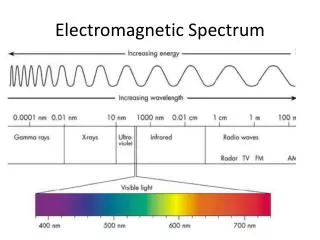
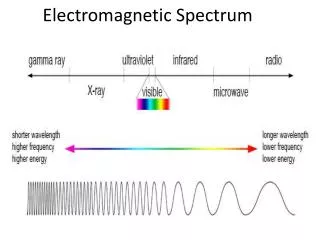
Electromagnetic Spectrum Visible / Near Infrared: 350 – 2,500 nm Mid Infrared: 2,500 – 25,000 nm Far Infrared (thermal): 25,000 – 106nm VNIR MIR
Spectroscopy • Measure of the interaction between matter and radiation • Color of object depends on wavelengths of light that are reflected Sun Albedo = reflected / incoming Incoming Radiation Soil
Infrared Spectroscopy Energy of atomic bonds absorbs IR radiation Greater abundance of specific bonds = higher concentration Atomic Bond Energy Vibration Bending Rotation
IR Spectroscopy • Established methodology for evaluating chemical bonds in various materials including clay minerals • Si-O; Al-O; H-O; C=O; C-OH; Fe-O; etc. • Laboratory measurement • Amount of IR radiation transmitted through thin film or solid suspension of material in non-absorbent media • In clay mineralogy, analysis of mineral structure; not quantification
Specular Transmission Reflectance Diffuse Diffuse Transmission (Forward Scatter) Absorption Reflectance Visible and Near InfraRedDiffuse Reflectance Spectroscopy • Spectra collected is diffuse (unfocused) cloud of reflected radiation • Overtones (secondary radiation) instead of primary • Broader, less well defined peaks • Cannot assign specific peaks to specific bonds
Btg 2Btg A Reflectance Wavelength (nm) Transmitted Primary versus Diffuse Radiation
Diffuse Reflectance IR Spectroscopy Reference Material – Ideal Reflectivity Reflected Incoming Radiation Detector Visible and IR Source Incoming Radiation Reflected Soil At each wavelength, the detector reports how much light is reflected by the soil compared with the reference material
VNIR for Quantifying Soil Properties • Spectrometry is a combination of spectroscopy and statistical methods to identify and quantify chemical species • Essentially the same as developing standard curve for any analytical instrument • Analyze a large number (>100) of known samples that have a range of values for component of interest, e.g. clay • Build statistical models that relate spectra to quantity of component – hyper multiple regression % clay = f(spectrum)
Evaluate Precision of Model Calcium Carbonate Equivalent, %, actual vs. predicted • Relationship will not be perfect • Precision of VNIR predictions is less than laboratory measurements Measured Clay (%) Calibration Estimated Clay (%)
Global vs. Stratified Models • Predictive models are best when samples represent a restricted range • Interference from other properties
How to Stratify for U.S. • Texture, classification, parent material, MLRA, etc. • Size of known sample set could be a problem • Stratify by spectral characteristics?
One Spectrum – Many Properties The same spectrum can be used to predict multiple properties. Scan Unknown Soil Total Carbon CEC Clay pH Carbonates P R E D I C T I O N S Key is development of acceptable predictive models SSL will have most extensive spectral library in world
Successful Predictions • Carbon; total and fractions • Particle size distribution • Chemical properties • Extractable Cations • CEC • Extractable acidity • Extractable Al • Selected trace elements • pH • Quartz, kaolinite, smectite • Water content • COLE • Other • CaCO3 • Gypsum • Available P • Most relationships developed from samples in limited area; plot to MLRA equivalent
Illinois Missouri MLRA 113 – The Central Claypan Regions Novelty Centralia
Clay Content Measured Clay (%) Measured Clay (%) Calibration Test Data Estimated Clay (%) Estimated Clay (%)
Organic Carbon Measured OC (%) Measured OC (%) Calibration Test Data Estimated OC (%) Estimated OC (%)
Cation Exchange (NH4OAc) Measured CEC (meq 100g-1) Measured CEC (meq 100g-1) Calibration Test Data Estimated CEC (meq 100g-1) Estimated CEC (meq 100g-1)
Exchangeable Calcium Measured Ca (meq 100g-1) Measured Ca (meq 100g-1) Calibration Test Data Estimated Ca (meq 100g-1) Estimated Ca (meq 100g-1)
pH R2 = 0.74 PLSR R2 = 0..66 RMSE = 0.4 RPD = 1.6
EC1:1 R2 = 0.65 PLSR R2 = 0.36 RMSE = 64.9 RPD = 1.2
Typical Soil Organic Matter Calibration Performance • Organic matter/organic C • % OM, % OC • Total C (LECO) • %C HUMUS • Humic acid fractions • Humic and Fulvic • Fulvic acid fractions • Lignin content • Cellulose content r2 0.81-0.97 0.93-0.96 0.94 0.95 0.91 0.63 0.77-0.83 0.81 Performance good – exc. v.good - exc. v.good v.good v.good poor good good Martin and Malley, PDK Projects, Inc. unpublished results
Texas Data Gypsum Clay r2 = 0.90 RMSE = 5% Predicted clay, % 1:1 line Measured clay, %
Coefficient of Linear Extensibility VNIR Spectroscopy Pedotransfer function* RMSD= 0.028 r2= 0.61 RPD= 1.6 RMSD= 0.029 r2= 0.57 RPD= 1.5 * clay content
Brown et al., 2006 4,184 samples from all 50 states plus Americas, Africa, Europe & Asia Large-scale VNIR Soil Calibrations Brown, D.J., Shepherd, K.D., Walsh, M.G., Mays, M.D., Reinsch, T.G. (2006) Global soil characterization with VNIR diffuse reflectance spectroscopy. Geoderma, v.132, n.3-4, p. 273-290.
Reflectance Spectra of Clay Minerals Shifting Al-OH absorbtion peak, 2200-2380nm. Water Absorption Peak, 1900nm Goetz, A. F. H., Chabrillat, S., Lu, Z. 2001. Field Reflectance Spectrometry for Detection of Swelling Clays at Construction Sites. Field Analytical Chemistry and Technology. 5(3):143-155, 2001.
Phosphorus • Nutrient often associated with water quality issues • Major topic within NRCS • Is soil overloaded with P? • VNIR has been reported to adequately quantify P in soils • Results from small area • Measurement of accessory properties? • Small quantities in soils even when soil is overloaded • Variety of absorbents • May be better able to quantify P adsorption capacity • Fe and Al oxides and oxyhydroxides major P adsorber • Relatively abundant
What Properties Should be Evaluated with VNIR • IR radiation interacts with chemical bonds • Expect best results from abundant components that have unique bonds • Clay, sand – Si-0, Al-O, Al-OH • Organic C – C-OH, C=O, etc. • CaCO3 – Ca-CO3 • Gypsum – Ca-SO4 • Clay minerals – indentify? Quantify – probably not • CEC – cations adsorbed on clay and organic matter (type and amount of clay and organic matter) • Extractable Ca – adsorption on clay and organic matter • Weaker relationship than other properties • Limited area; similar Ca saturation?; type and amount of clay? • ESP? • pH, EC – weak models • No chemical bonds directly related to properties • Relation to other components? • P, trace elements, etc. – models applicable for limited region or soils? • Accessory properties
VNIR after Rapid Carbon - Why? • Large demand for Soil Property Data • Estimated or measured values? • What is the mean, variance, confidence limits?
More Samples and Measurements • Equipment • Time • Money Time may be greatest limitation Are VNIR data a reasonable alternative? Data are less robust than conventional measurements
Benefits of VNIR for Soil Analysis • Low per-sample cost • Little or no sample preparation • Rapid measurement • Possible to perform the analysis in the field? • Ability to collect data for multiple locations • Statistical validity for data • Is it really fine or fine-loamy? • Ability to collect data a fine depth increments • Property distribution with depth not restricted to genetic horizons • Single spectrum to predict multiple soil properties • Critical part is valid predictive models • Supplement to, not a replacement for laboratory measurement by conventional methods • Less precise
Use of VNIR in Field? • Equipment is field compatible • Water is strong absorber of IR radiation • Variable water content = variable absorption • Non-homogenous material • Air-dry and crushed = homogenous • Field state = hetrogenous • Mottles • Coatings • Redox features • Research underway to correct for water content (mathematically) and to evaluate effects of non-uniform material Water Absorption Peak
VNIR and NRCS SSL • 5-6,000 samples analyzed each year • VNIR spectra being collected for each sample • Moist and dry • Largest spectral library in the world • Ability to stratify samples to improve precision of predictions • Library will be available to the public
VNIR and the NCSS • Is precision good enough? • Depends on the question • Analysis of a single representative pedon • Not a good technique • Analysis of multiple sites of same soil to estimate mean and data confidence • May be good enough for many properties • VNIR not to replace standard analytical methods • Good to increase replicates
VNIR Summary • Viable method for evaluation of soil properties • Data are spectra • Property values depend on calibration model • Not a replacement for standard methods • Lower precision • Rapid data collection allows greater replication • Representative site pre-screening • Large “N” for statistical analysis and confidence limits • Close interval (depth and distance) data collection • Does the property fit the analytical theory? • Additional methods and predictive models will be developed in the future • Applications will depend on soil scientists in the field
Questions? Comments?