Download
1 / 80
800 likes | 930 Views
South Island Health Status and Health Service Utilization. Grant Hollett and Jani Urquhart Vancouver Island Health Authority Planning and Community Engagement April 10 th , 2013. Disclaimer: Please Read.

E N D
South Island Health Status and Health Service Utilization Grant Hollett and Jani Urquhart Vancouver Island Health Authority Planning and Community Engagement April 10th, 2013
Disclaimer: Please Read • These indicators were chosen to provide a broad overview of health status and utilization in the South Island region. There are many other indicators to take into account when planning services or programs. • Please always check the date and source of data. • Please consider whether the data is a percentage or a rate. • Some indicators are influenced by small numbers. This can make a small number of events look significant and sometimes result in an inflated rate. Successful improvements in health can only come about with the involvement of an entire community. Partnering of community organizations, all levels of government, and community members, is essential. VIHA can be a participant in such partnerships, but does not necessarily play a primary role in addressing these issues.
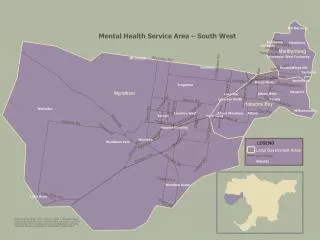
Presentation Overview • VIHA Overview • CSC Boundary/Map • Demographics • Social Determinants of Health • Health Status • Health Services Utilization • Community Services • Service Overlap
VIHA Quick Statistics 776,000 population served (17% of BC) 56,000kilometres squared 18,500 health care professionals 1,800 physician partners 1,500 acute care beds 150+ facilities $2 billion budget PEOPLE, IDEAS, Health Service Plan
Proportion of 2012 Population by 5-Year Age Groups Compared to VIHA and BC Sooke South Island Saanich BC Statistics P.E.O.P.L.E. 2012
Population Change 2012-2032 BC Statistics P.E.O.P.L.E. 2012
Economic Status 1BC Statistics 2010 Profiles (2006 Census) 2 BC Statistics 2010 Profiles
Education 1BC Statistics 2010 Profiles (2007/08-2009/10) 22006 Census
Housing 2006 Census
Social Support 2006 Census
Healthy Development 1BC Ministry of Social Development, 2010; 2Ministry of Children and Family Development
Child Health 1BC Statistics 2009-2010; 2BC Perinatal Program 2003/2004-2007/2008)
Crime 1BC Statistics Agency 2010; 2BC Statistics Agency 2007-2009
Indicates statistically significant BC Vital Statistics 2010 Report (2006-2010)
Indicates statistically significant BC Vital Statistics 2010 Report (2006-2010)
Indicates statistically significant BC Vital Statistics 2010 Report (2006-2010)
Indicates statistically significant BC Vital Statistics 2010 Report (2006-2010)
Prevalence of Chronic Conditions 2009/10 Ministry of Health Primary Care Chronic Disease Registries 2009-2010
Hospital Visits by LHA of Residence BC Discharge Abstract Database (DAD) 2010/2011
Blue Matrix – Overview • Developed by the Ministry of Health • Links patient data from multiple sources: • All billing records (MSP) • Hospital discharge abstracts (DAD) • Home and community care datasets • Etc.
Blue Matrix Population Segments PS00 Non User PS01 Healthy PS02 Adult Major Age 18+ PS03 Child and Youth Major <18 PS04 Low Complex Chronic Conditions PS09 Severe Disability PS08 Frail in the Community PS07 Maternity and Healthy Newborns PS06 Mental Health and Substance Use PS05 Medium Complex Chronic Conditions PS10 High Complex Chronic Conditions PS11 Cancer PS12 Frail in Care (in Residential Care) PS13 End of Life
Population Segments Ministry of Health Blue Matrix 2008/09
Population Segments Ministry of Health Blue Matrix 2008/09
Population Segment Costs Ministry of Health Blue Matrix 2008/09
Population Segment Costs Ministry of Health Blue Matrix 2008/09
Cost Per Patient Ministry of Health Blue Matrix 2008/09
Cost Per Patient Ministry of Health Blue Matrix 2008/09
Acute Inpatient Case Rates Discharge Abstract Database (DAD) 2009/2011
Acute Inpatient Case Rates Discharge Abstract Database (DAD) 2009/2011
Newborn Case Rates Discharge Abstract Database (DAD) 2009/2011
Newborn Case Rates Discharge Abstract Database (DAD) 2009/2011
Surgery Case Rates Discharge Abstract Database (DAD) 2009/2011
Surgery Case Rates Discharge Abstract Database (DAD) 2009/2011
ED Visit Rates FirstNET 2009-2011
ED Visit Rates FirstNET 2009-2011
ED Visits and Admissions by Presenting Complaint FirstNET Feb-Oct 2012
ED Admissions by Presenting Complaint FirstNET Feb-Oct 2012
ED Admissions by Presenting Complaint FirstNET Feb-Oct 2012
ED Visits by CTAS Level : Resuscitative : Emergent : Urgent : Less Urgent : Non-urgent