Download

1 / 13
130 likes | 250 Views
A MORE DETAILED ANALYSIS OF THE FINANCIAL REPORTS. Discount, Variety Store - Costco Aileen Huang. Costco. Established in 1983 71,200 members 451 Warehouses/stores in U.S. Sales: $103m; Net income: $2m Competitors: Sam’s Club, BJ Wholesale

E N D
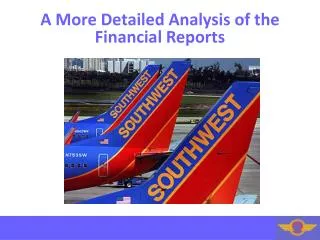
A MORE DETAILED ANALYSIS OF THE FINANCIAL REPORTS Discount, Variety Store - Costco Aileen Huang
Costco • Established in 1983 • 71,200 members • 451 Warehouses/stores in U.S. • Sales: $103m; Net income: $2m • Competitors: Sam’s Club, BJ Wholesale • Started same time, only three big wholesale clubs still in operation • Market share 67% Sam’s Club; 17% Costco • 2013 NEA $11,565M; NFL $732; EPAT 1,818; FEAT -$35
Inventory LIFO/FIFO Comparison • Assume using LIFO for all U.S. inventory • The accumulative impact of the LIFO valuation was $81 and $108 • FIFO > LIFO • Due to net deflationary trends in 2013, a benefit of $27 was recorded to reduce LIFO valuation; inflationary trends in 2012 resulted a charge to merchandise costs of $21
Inventory LIFO/FIFO Comparison • Balance Sheet effect • Increase in inventory$81.0 • Tax saving -30.1 • NEA increased by 50.9 • Income statement effect • LIFO reserve decrease27.0 • Tax saving -10.0 • EPAT lower by 17.0
Operating leases vs. capital leases • IRR6.74%
Operating leases vs. capital leases • Balance Sheet effect • NEA increase $1,564 • NFL current 13.96 • NFL noncurrent 1,549.64 • Income Statement effect • Operating expense $225 • Interest expense 105.39 • Depreciation expense95.0 • EPAT increase 81.8 • FEAT increase 66.3
Share-Based Compensation • Step 1: the value of options at beginning of 2013 by using beginning of year share price • 3,161*(90.2-40.9)=$155,837
Share-Based Compensation • Step 2: the value of options at beginning of 2013 using end of year share price • 3,161*(111.4-39.7)=$226,644
Share-Based Compensation • Step 3: the value of options exercised during 2013 • 1,435*(102.25-36.22)=$92,672
Share-Based Compensation • Step 4: the value of options cancelled during this year • $0
Share-Based Compensation • Step 5: the value of options at end of 2013 using end of year share price • 1,726*(111.4-39.7)=$123,754
Share-Based Compensation • Step 6: an estimate of additional share-based compensation • (5)-(2)+(3)+(4)=-$10,217
Share-Based Compensation • Step 7: adjusting • Increased NFL: $123,754 • Decrease CSE: $123,754 • Increase EPAT: $10,217 • Decrease FEAT: $21,866 • (2)-(1)-(3)-(4)