Download
1 / 8
80 likes | 225 Views
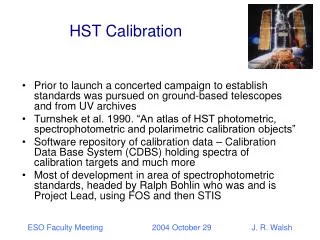
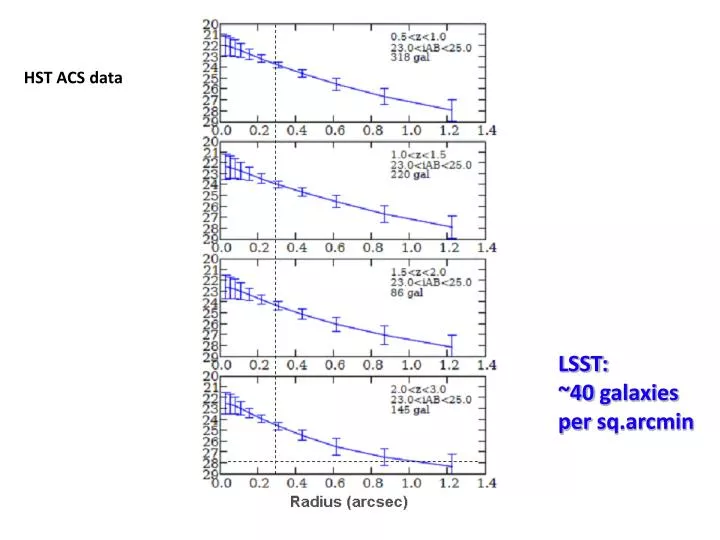
HST ACS data. LSST: ~40 galaxies per sq.arcmin. Required accuracy on theoretical predictions. LSST will achieve percent level statistical accuracy on lensing power over a decade. Thus systematics contribution should be at the 10 -7 level or lower.

E N D
HST ACS data LSST: ~40 galaxies per sq.arcmin
Required accuracy on theoretical predictions LSST will achieve percent level statistical accuracy on lensing power over a decade.Thus systematics contribution should be at the 10-7 level or lower. Predictions for the gravitational part achievable with N-body simulations: e.g. published and ongoing work with Coyote Simulations Gas physics effects need models, simulations, and methods to calibrate from data: ongoing. lmax ~ 1000-2000 appears achievable Eifler 2010, updated
LSST SRD shear specs Residual correlations for the two shear components in a single15 sec simulated LSST image are shown on degree scales where much of the cosmological information will reside. This should average down like the number of exposures. Note this simulation included only the atmosphere and a simple model of the telescope optics.
Systematic Errors: Overview I Lensing->cosmology pipeline: 1. Object detection and star-galaxy classification 2. PSF (point spread function) measurement from stars 3. PSF interpolation onto galaxy positions 4. Galaxy shape measurement and PSF deconvolution (or equivalent) 5. Measurements of shear correlations and covariances 6. Tomography (redshift binning) and inference of cosmological parameters Systematic errors that can enter into the various steps of the lensing->cosmology pipeline: • Theory uncertainty/high linformation • Intrinsic alignments • Photo-z calibration • Shear calibration • PSF correction
Systematic Errors: Overview II • For cosmological applications, essentially all lensingsystematics may be classified as one of three kinds: 1. Additive, 2. Multiplicative, 3. Redshift errors • Intrinsic alignment errors (1) • Linear alignment model. Recent bounds from data (SDSS/MegaZ) are useful but better measurements from Stage III surveys will help. • Spectroscopic calibration of photo-z’s (3) • Photo-z’s are characterized by scatter and bias. Bias required to be controlled at the ~0.003 level for LSST. • Calibration by spectroscopic redshifts can be eased by cross-correlation methods. • Shear calibration (2): • With simulated images can get sub-percent performance in high S/N regime. • Ongoing work on algorithms aimed at Stage III and LSST requirements: ~0.002 level calibration. • PSF correction (1) (also connected to shear calibration) • Telescope and active optics designed to reduce coherent PSF anisotropy • Multiple exposures help reduce PSF from stochastic sources - atmosphere etc. • Cross-correlating shapes from different exposures further reduces stochastic residual • PCA based interpolation corrects non-stochastic sources and improves with survey size 3 2 1
Systematic Errors: Overview III Sources of systematic errors Nature of advance • Theoretical prediction Nonlinear modeling. Gas physics? • Intrinsic Alignments Need better constraints from data. Advances in modeling uncertain. Self-calibrates but with significant degradation. • Source redshift distribution Spectroscopic data and techniques • Shear calibration Algorithm driven. Partially self-calibrates. • PSF anisotropy Telescope design & performance. Atmosphere/stochastic contribution reduced by large number of exposures. • Interpolation of PSF Algorithm development. PCA approach already scales with survey size. Note: For systematics like PSF correction, current datasize (~2 million galaxies) is what limits tests of systematic correction schemes.
sensitivity of WL+BAO to systematic error Hu Zhan 2009 p/r = w0 + wa(1-a) photo-z cross correlations calibrate d<z> to 0.01 at z=1. Combining WL and BAO breaks degeneracies. Joint analysis of WL & BAO is less affected by the systematics