Download
1 / 24
240 likes | 396 Views
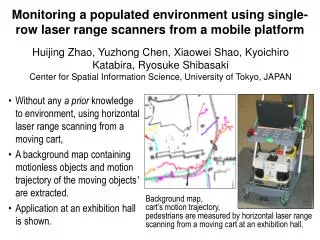
A Method for Modeling of Pedestrian Flow in the Obstacle Space using Laser Range Scanners. Yoshitaka NAKAMURA † , Yusuke WADA ‡ , Teruo HIGASHINO ‡ & Osamu TAKAHASHI † † Future University Hakodate, JAPAN ‡ Osaka University, JAPAN. Background. Development of sensing technologies

E N D
A Method for Modeling of Pedestrian Flow in the Obstacle Space using Laser Range Scanners Yoshitaka NAKAMURA†, Yusuke WADA‡, Teruo HIGASHINO‡ & Osamu TAKAHASHI† †Future University Hakodate, JAPAN ‡Osaka University, JAPAN
Background • Development of sensing technologies • Various phenomena become able to be measured as digital data • Some services based on this measuring data can be provided • Pedestrian flow attracts attention • Movement of the pedestrians • For orientation of the services based on mobility pattern of pedestrians • For urban planning • For control of pedestrian for refuge instructions IWIN2011
Purpose of Research • To generate pedestrian flow model with high accuracy and law cost • Cost of measuring sensor • Price of sensor is as low as possible • Number of sensor is as little as possible • Cost of data processing • Information to use is as little as possible IWIN2011
Related Work • Pedestrian flow detection • Cameras • By recognizing the images of pedestrians • Disadvantage: Privacy, Setting cost, Angle of view • RFID tag • By tracking with RFID of each pedestrian • Disadvantage: Cost of RFIDs • Counting number of pedestrians • By counting the passage number of pedestrians in each gateway • Disadvantage: Affected by occlusions IWIN2011
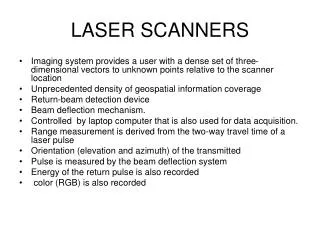
Laser Range Scanners(LRS) • Measures the distance to an object from LRS • Advantage • Fast scanning of wide area • Little probabilityto infringe pedestrian’s privacy • Small cost of calculation • (Simple tracking by the difference of data is possible) • Disadvantage • Easy to lose target objects by obstacles • Difficult to measure all pedestrians completely IWIN2011
Measuring Data of LRS • Measurement time • Position coordinate of pedestrian • IDof pedestrian assigned by simple tracking of UTM-30LX • Simple tracking of UTM-30LX • Judge the same pedstrianfrom the difference of measured data and assign ID to the pedestrian • If tracking is succeed, pedestrian’s movement history can be found by ID • ID becomes extinct in the place where tracking of the pedestrian failed • Even if the same pedestrian is found again, the other ID is assigned IWIN2011
Precedent Experiment(1/2) • Conducted in “Whity Umeda” • By synchronizing 4 LRSs(HOKUYO UTM-30LX) • Measure the height of pedestrians’ waist[17] [17] Kawata, Ohya, Yuta, Santosh and Mori, “Development of ultra small lightweight optical range sensor system,” in Proc. of IROS2005 IWIN2011
Precedent Experiment(2/2) • Beige area is the movable area of pedestrians • Orange columns are LRSs • Pink lines are the measuring laser of LRSs 33m 26m IWIN2011
Performance of Tracking • Simple tracking of UTM-30LX could continue only for a short time • 30%~40% of IDs’ life times are only 1 second • Pedestrians are hidden behind obstacles such as pillars • Pedestrians are also hidden behind other pedestrians • Some pedestrians are staying near LRS and become large obstacles =>The other approaches are needed for pedestrian flow generation IWIN2011
Approach • Pedestrian flow is often used in • Trajectory analysis of customers in commercial facilities • Pedestrian flow analysis for refuge instruction, etc. • In such case, tendencies of the pedestrians’ movement are more important than actual behaviors of pedestrians • Accurate tracking is impossible Pay attention to the change of population density in the partial domain of the measurement area IWIN2011
Proposed Method • Generate the pedestrian flow model from the population density • Divide measurement area into some square domains(cells) • Calculate population density of each domain • Generate flow model based on the change and distribution of population density IWIN2011
Assumptions • Pedestrians move to the only adjacent cell (in all directions)from the cell where himself/herself is now • Pedestrians move from the entrance to the exit without making a detour under Assumption 1 • Pedestrian is measured only once in each cell where he/she passes IWIN2011
Overview of Method • Dived the measurement area into some unit cells • Select the gateway cells • Suppose the route candidate between each 2 gateways • Calculate the population density of each cell • Calculate the number of sojourners • Estimate the route where the pedestrian passed and its traffic • Determinate the direction of the flow IWIN2011
Supposition of the Route Candidate • Suppose the route candidate according to Assumptions 1 & 2 between each two different gateway cells. IWIN2011
Calculation of the Population Density • Count it up how many pedestrians existed in each cell for constant period of time=> Population Density • Exclude pedestrians moving at a speed less than minimum speed as sojourners • Minimum speed = 20cm/s 0 5 Sojourners 3 4 1 5 1 4 5 4 IWIN2011
Estimation of the Route • One route corresponds to one pedestrian • Decide a route candidate passing a cell with high density as a route • Update the density data to the data removed a decided route • Repeat the process until the population of all cells become almost 0 0 5 4 0 1 0 0 4 5 1 4 0 0 3 5 4 0 4 3 0 IWIN2011
Determination of Direction • Detect the speed and direction of pedestrians’ movement from tracking data of UTM-30LXs • Count the direction ratio of pedestrians’ movement in each cell on route candidates • Determine the direction ratio of route based on direction ratio of pedestrian’s movement IWIN2011
Example of Generated Flow(1/2) • Direction of arrow: Direction of the pedestrian flow • Thickness of arrow: Quantity of the pedestrian flow • Numbers in Circles: Average number of sojourners of same cell for each 1 minute sojourners 4 sojourner 1 sojourners 3 Moring IWIN2011
Example of Generated Flow(2/2) • Direction of arrow: Direction of the pedestrian flow • Thickness of arrow: Quantity of the pedestrian flow • Numbers in Circles: Average number of sojourners of same cell for each 1 minute sojourners sojourners 2 2 sojourners 3 sojourners 6 Evening IWIN2011
Performance Evaluation • Evaluate the generated model using scenario data formed by MobiREAL based on the number of pedestrians in the gateway cells • Compare the pedestrian flow model generated by proposed method with the pedestrian’s movement of scenario data IWIN2011
Scenario Data • Set the origin and destination point of each node • Generate a realistic movement model using MobiREAL IWIN2011
Agreement Rate • Compare the flow model generated from the scenario data by proposed method with the scenario data Scenario data Flow model • Agreement rate: Ratio ofthe cell which the route of generation model passed is the same as scenario data • Average agreement rate of route in the whole scenario is about 80.79% Agreement rate: 67% IWIN2011
Discussion • Accuracy of the measuring population density • This method takes the average value of several minutes • the tendency of the pedestrian flow does not change in a short time • the disappearance of the pedestrian by the obstacle is keeping for an instant • Actually, the disappearing pedestrians exist for a long time depending on the placement of the obstacles(pedestrians) • It is necessary to consider about method to estimate density by disappearance probability or different method to calculate the density by flow quantity IWIN2011
Conclusion • Proposed a method for modeling pedestrian flow in the space such as underground shopping center • Using Laser Range Scanners • Using the change of population density • Future work • Different calculation method of density corresponding to the real environment • Comparison with the data which completely measured the movement trace of each pedestrian IWIN2011