Download
1 / 12
120 likes | 315 Views
Arizona HMT Soil Moisture Network. Robert J Zamora NOAA Earth System Research Laboratory Physical Sciences Division Boulder, CO. Overview. Six soil moisture monitoring sites in the Babocomari River Basin Soil moisture and temperature at standard NRCS depths (5, 10, 20, 50, 100 cm)

E N D
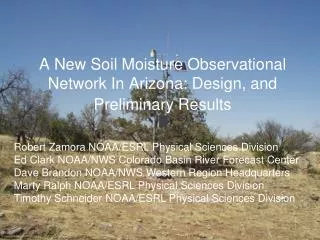
Arizona HMT Soil Moisture Network Robert J Zamora NOAA Earth System Research Laboratory Physical Sciences Division Boulder, CO
Overview Six soil moisture monitoring sites in the Babocomari River Basin Soil moisture and temperature at standard NRCS depths (5, 10, 20, 50, 100 cm) Surface air temperature and relative humidity Tipping Bucket Rain Gages Two minute temporal resolution transmitted to Boulder hourly
HMT Arizona Soil Moisture Network FBK + + TUS Fairbank, AZ online 1/2011
Babocomari River Flood 23 July 2008 • Second highest discharge measured on the river in the period of record • First flood event captured by the HMT network
Meteorological Setting • Typical monsoon upper air pattern consisting of a ridge over the four corners region • No dynamic forcing • Significant Convective Instability • CAPE= 2768 J/kg • LI= -4.77 • Precipitable Water= 52.52mm July 22, 2008 12 UTC July 23, 2008 00 UTC
Soil Moisture Response Lower Basin (WSE) 50 cm Caliche Upper Basin (FMS) 100 cm Caliche • HMT Network data indicates that the lower Babocomari basin was saturated before the flood • The upper basin had lower soil moisture values • Significant streamflow response in the lower Babocomari River
StreamflowResponse Hydrograph Data: • No streamflowresponse in the upper Babocomari River basin Red Arrows Indicate Flow Direction
Milestones • Six stations operational in Arizona • Handbook 5 ID’s for Arizona stations • All preliminary data displayed in near real-time on PSD-2 data webpages http://www.esrl.noaa.govh/psd/data/obs/surfacefluxobs/soil/soil.php • Zamora, R. J., F. M. Ralph, E. Clark, and T. Schneider, 2011: The NOAA Hydrometeorology testbed soil moisture observing networks: Design instrumentation, and preliminary results Journal of Atmospheric and Oceanic Technology, 28,1129-1140. • Zamora, R. J., E. Clark, E. Rogers, M. B. Ek, and T. A. Lahmers, 2012: An examination of soil moisture conditions in the Babocomari River Basin: The flood event of 23 July 2008. to be submitted to Journal of Hydrometeorology
HMT Data and the Noah Land Surface Model • NAM Grid Point v. HMT comparisons:
Soil Moisture Differences Noah LSM Level 1 and HMT 5 cm: Noah LSM Level 2 and HMT 20 cm: • Noah LSM soil moisture values show dry bias in the lower basin • Wet bias in upper basin, seen at both ELG, and FMS
TUS • •WHT Tucson 88D radar coverage at 1.0°