Download
1 / 24
240 likes | 374 Views
The Colorado River: Operation, Current and Projected Future Conditions Southern California Water Dialogue Los Angeles, CA April 27, 2011. Overview. Basin Overview Current System Conditions & Operations Projected System Conditions. Colorado River Basin

E N D
The Colorado River: Operation, Current and Projected Future Conditions Southern California Water Dialogue Los Angeles, CA April 27, 2011
Overview • Basin Overview • Current System Conditions & Operations • Projected System Conditions
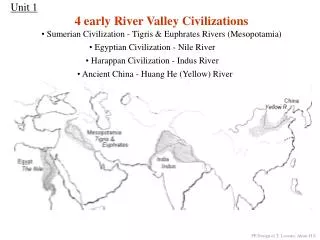
Colorado River Basin • 16.5 million acre-feet (maf) allocated annually • 13 to 14.5 maf of consumptive use annually • 15.0 maf average annual “natural” inflow into Lake Powell over past 100 years • Inflows are highly variable year-to-year • 60 maf of storage
Water Year Snowpack and Precipitationas of April 25, 2011 Colorado River Basin above Lake Powell Water Year Precipitation (year-to-date) 122% Current Snowpack 130% Chart developed with Snotel data as of 4/25/2011 Source: CBRFC
Lake Powell & Lake MeadOperational Diagrams and Current Conditions 3,611 12.79 4/24/11 4/24/11 1,096 11.14 4/24/11 4/24/11
April 2011 Results from CRSS Probabilities of occurrence, values in percent
Colorado River Basin Water Supply and Demand Study • Two-year, $2 million study cost shared by Reclamation and the Basin States • Assess future water supply and demand imbalance over the next 50 years • Assess risks to all Basin resources • Investigate options and strategies to mitigate impacts • Study will identify and evaluate options, not at feasibility level • A transparent, collaborative study with input from all stakeholders • Email: ColoradoRiverBasinStudy@usbr.gov • Website: http://www.usbr.gov/lc/region/programs/ crbstudy.html
Addressing an Uncertain Future • The path of major influences on the Colorado River system is uncertain and can not be represented by a single view • An infinite number of plausible futures exist • A manageable and informative number of scenarios are being developed to explore the broad range of futures Scenario Funnel
* Additional “branches” possible depending upon assumed trajectory of specific socio-economic factors. Water Supply Scenarios * Water Demand Scenarios * Current Trends: growth, development patterns, and institutions continue along recent trends Economic Slowdown: low growth with emphasis on economic efficiency Expansive Growth: economic resurgence (population and energy) and current preferences toward human and environmental values * Enhanced Environment and Healthy Economy: expanded environmental awareness and stewardship with growing economy* Observed Resampled: • future hydrologic trends and variability will be similar to the past 100 years Paleo Resampled: • future hydrologic trends and variability are represented by the distant past (approximately 1250 years) Paleo Conditioned: • future hydrologic trends and variability are represented by a blend of the wet dry states of the paleo-climate record but magnitudes are more similar to the observed period Downscaled GCM Projected: • future climate will continue to warm with regional precipitation trends represented through an ensemble of future GCM projections * Preliminary – Subject to change
The Colorado River: Operations and Current Conditions For further information: http://www.usbr.gov/lc/region
Natural FlowColorado River at Lees Ferry Gaging Station, ArizonaWater Year 1906 to 2011
Seven years of unprecedented drought Increased water use To date, there has never been a shortage in the Lower Basin and there were no shortage guidelines Operations between Lake Powell and Lake Mead were coordinated only at the higher reservoir levels “equalization” Impetus for the Interim Guidelines
Interim Guidelines1 - A Robust Solution Operations specified through the full range of operation for Lake Powell and Lake Mead Encourage efficient and flexible use and management of Colorado River water through the ICS mechanism Strategy for shortages in the Lower Basin, including a provision for additional shortages if warranted2 In place for an interim period (through 2026) to gain valuable operational experience Basin States agree to consult before resorting to litigation • Issued in Record of Decision, dated December 13, 2007; available at http://www.usbr.gov/lc/region/programs/strategies.html • Mexico water deliveries are not directly affected by these guidelines
2011 Upper ColoradoForecasted Apr–Jul Inflowas of April 15 Flaming Gorge – 126% Blue Mesa – 111% Navajo – 70% Lake Powell – 122%
Lake Mead Capacity 1,219.6 ft 25.9 maf Surplus Conditions 124 ft 15.9 maf 1,145 ft Normal or ICS Surplus Conditions 1,096 ft 11.14 maf (43% of Live Capacity) 46 ft 1,075 ft Shortage Conditions Min Power Pool 1,050 ft Inactive Pool (7.5 maf) Lower SNWA Intake 1,000 ft Dead Pool Elevation 895 ft Dead Pool (2.0 maf) As of Apr 24, 2011 Not to scale
Historic Colorado River Water Supply & Use(10-year Running Average)
Colorado River Basin Storage(as of April 24, 2011) *Total system storage was 32.75 maf or 55% this time last year