Download
1 / 15
150 likes | 252 Views
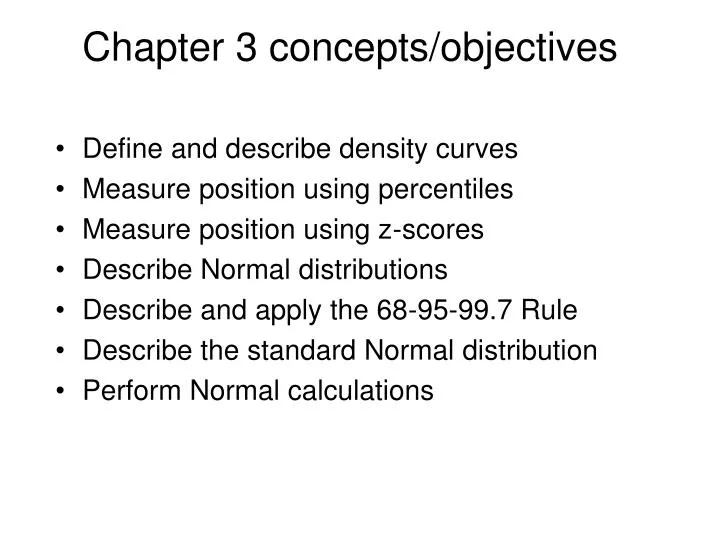
Chapter 3 concepts/objectives. Define and describe density curves Measure position using percentiles Measure position using z-scores Describe Normal distributions Describe and apply the 68-95-99.7 Rule Describe the standard Normal distribution Perform Normal calculations.

E N D
Chapter 3 concepts/objectives • Define and describe density curves • Measure position using percentiles • Measure position using z-scores • Describe Normal distributions • Describe and apply the 68-95-99.7 Rule • Describe the standard Normal distribution • Perform Normal calculations
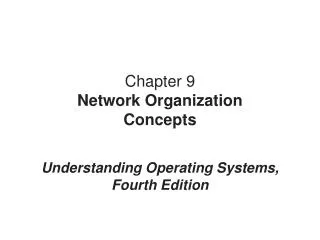
The 68-95-99.7 Rule • The 68-95-99.7 Rule • In the Normal distribution with mean µ and standard deviation σ: • Approximately 68% of the observations fall within σ of µ. • Approximately 95% of the observations fall within 2σ of µ. • Approximately 99.7% of the observations fall within 3σ of µ. σ
The Standard Normal Distribution • All Normal distributions are the same if we measure in units of size σ from the mean µ as center. The standard Normal distributionis the Normal distribution with mean 0 and standard deviation 1. If a variable x has any Normal distribution N(µ,σ) with mean µ and standard deviation σ, then the standardized variable has the standard Normal distribution, N(0,1).
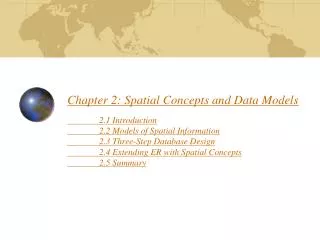
Normal Calculations Find the proportion of observations from the standard Normal distribution that are between -1.25 and 0.81. Can you find the same proportion using a different approach? 1 – (0.1056+0.2090) = 1 – 0.3146 = 0.6854
Normal Calculations How to Solve Problems Involving Normal Distributions • State: Express the problem in terms of the observed variable x. • Plan: Draw a picture of the distribution and shade the areaof interest under the curve. • Solve: Perform calculations. • Standardizex to restate the problem in terms of a standard Normal variable z. • Use Table A and the fact that the total area under the curve is 1 to find the required area under the standard Normal curve. • Conclude:State the conclusion in the context.
Chapter 4 concepts/objectives • Explanatory and Response Variables • Displaying Relationships: Scatterplots • Interpreting Scatterplots • Measuring Linear Association: Correlation • Facts About Correlation
The Standard Normal Distribution • All Normal distributions are the same if we measure in units of size σ from the mean µ as center. • The standard Normal distributionis the Normal distribution with mean 0 and standard deviation 1. • If a variable x has any Normal distribution N(µ,σ) with mean µ and standard deviation σ, then the standardizedvariable. • has the standard Normal distribution, N(0,1).
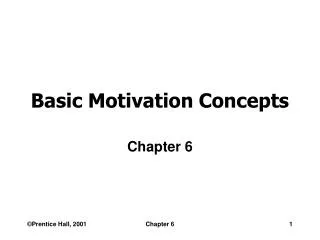
Measuring Linear Association • A scatterplot displays the strength, direction, and form of the relationship between two quantitative variables • The correlation rmeasures the strength of the linear relationship between two quantitative variables. • r is always a number between -1 and 1. • r > 0 indicates a positive association. • r < 0 indicates a negative association. • Values of r near 0 indicate a very weak linear relationship. • The strength of the linear relationship increases as r moves away from 0 toward -1 or 1. • The extreme values r = -1 and r = 1 occur only in the case of a perfect linear relationship.
Facts About Correlation • Correlation makes no distinction between explanatory and response variables. • r has no units and does not change when we change the units of measurement of x, y, or both. • Positive r indicates positive association between the variables, and negative r indicates negative association. • The correlation r is always a number between -1 and 1. • Cautions: • Correlation requires that both variables be quantitative. • Correlation does not describe curved relationships between variables, no matter how strong the relationship is. • Correlation is not resistant. r is strongly affected by a few outlying observations. • Correlation is not a complete summary of two-variable data.
Chapter 5 -- Regression Line ^ • x is the value of the explanatory variable. • “y-hat” is the predicted value of the response variable for a given value of x (based on the line of best fit). • b is the slope, the amount by which y changes for each one-unit increase in x. • ais the intercept, the value of y when x = 0. Regression equation: y = a + bx
Least Squares Regression Line Least Squares Regression Line (LSRL): • The line that minimizes the sum of the squares of the vertical distances of the data points from the line. For LSRL, the constants a (intercept)and b (slope) are calculated and inserted in the regression line. • Regression equation: y = a + bx • Calculate b from: • Calculate a from: • where sx and sy are the standard deviations of the two variables x and y, and r is their correlation. ^ To predict y, we want the regression line to be as close as possible to the data points in the y (vertical) direction.
Outliers and Influential Points • An outlieris an observation that lies far away from the other observations. • Outliers in the ydirection have large residuals. • Outliers in the x direction are often influential for the least-squares regression line, meaning that the removal of such points would markedly change the equation of the line.
Chapter 6 --Two-Way Table, Example What are the variables described by this two-way table? (Hint: Number of columns?) How many young adults were surveyed? (Hint: It is one of the totals in bottom row.)
Chap 6, Marginal Distribution TheMarginal Distribution of one of the categorical variables in a two-way table of counts is the distribution of values of that variable among all individuals described by the table. Note:Percents are often more informative than counts, especially when comparing groups of different sizes. To examine a marginal distribution: Use the data in the table to calculate the marginal distribution (in percents) of the row or column totals. Make a graph to display the marginal distribution.
Chap. 6 -- Conditional Distribution 15 A Conditional Distribution of a variable describes the values of that variable among individuals who have a specific value of another variable. • To examine or compare conditional distributions: • Select the row(s) or column(s) of interest. • Use the data in the table to calculate the conditional distribution (in percents) of the row(s) or column(s). • Make a graph to display the conditional distribution. • Use a side-by-side bar graph or segmented bar graph to compare distributions. Marginal distributions tell us nothing about the relationship between two variables.