Download
1 / 76
760 likes | 882 Views
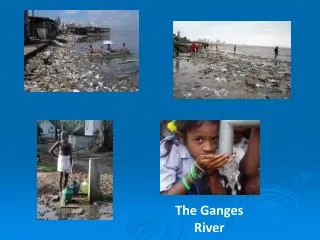
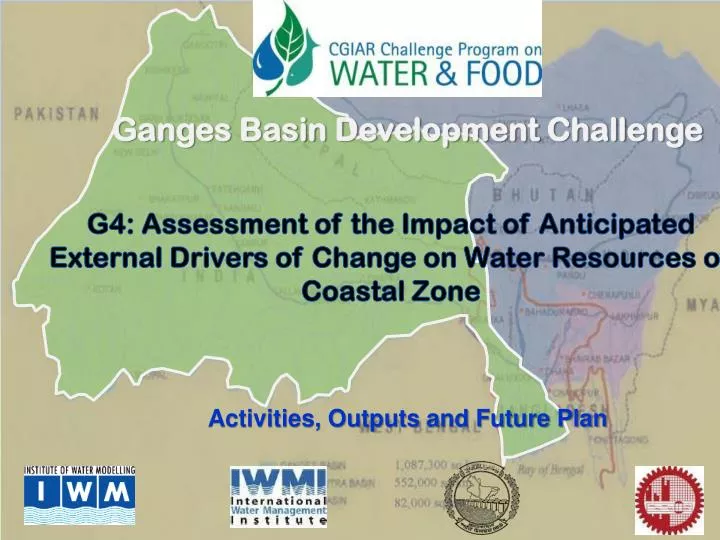
Ganges Basin Development Challenge. G4: Assessment of the Impact of Anticipated External Drivers of Change on Water Resources of Coastal Zone. Activities, Outputs and Future Plan. Outcome Logic Model. Outcome Logic Model. OUTCOMES. Farmers and fishers of polder 3, 30 and 43/2F.

E N D
Ganges Basin Development Challenge G4: Assessment of the Impact of Anticipated External Drivers of Change on Water Resources of Coastal Zone Activities, Outputs and Future Plan
Outcome Logic Model Outcome Logic Model OUTCOMES • Farmers and fishers of polder 3, 30 and 43/2F Change in KAS Change in Practice/ behavior Ministries of water resources, environment & forests, agriculture and fisheries in Bangladesh – Scaling up Understanding of the effects of external drivers & anticipated change of water resources and the benefits of adaptation measures will encourage these policymakers to be motivated to formulate new policies. It will also enable them for advocacy to the development partners. Impact Encouraged to participate in discussions • Awareness building • Knowledge enhancement Project outputs Improved and resilient water infrastructure and operation Improved Polder management for maximizing crop & fish production and minimizing inundation risk due to flood in collaboration with other Gs • Existing condition: • Detailed map of polders & land type, • Data, Freshwater & salinity zoning map • Water-logging map inside the polders • Digital Elevation Model Researchers of G1, G2, G3 & other ongoing projects • Use of data, information & knowledge Understanding external drivers, scenarios and their effects Use of data & information Development of new database • External drivers • Scenarios • LGI,BWDB, WARPO, LGED and NGOs Acquiring new information & knowledge Understanding the benefits of using new information and improved plan for proper drainage and irrigation Improved planning, design and implementation of water infrastructure • Future condition: • Population projection • Land use change • Detailed map of polders & land type, • Data, Freshwater & salinity zoning map • Water-logging map inside the polders Ministry of Water Resources, C.C. Cell, Planning Commission Understanding of effects of external drivers Motivated and encouraged to use the new information Assimilation of new knowledge and information in project planning and approval • Improved water infrastructure plan of the three polders
Overall Methodology G4: Assessment of the impact of anticipated external drivers of change on water resources of the coastal zone Water Flow and Salinity Modelling Model Development Calibration Validation Field Survey and Data Collection Defining Study Area Literature Review Selection of Drivers of Change Involving Gsand other Stakeholders Simulation of Baseline Condition Simulation of Scenarios Selection of Scenarios Involving Gsand Stakeholders Improved drainage and storage plan Up-scaling to LGED, WARPO, BWDB, DoE, Climate Change Cell Involving G5
External Drivers and Future Scenarios Scenario Generation Workshop Final List of Key External Drivers and Their Ranking Combination Scenarios
Scenarios Upstream Boundaries (Q, Sal = 0pt) Minimum and maximum flow in Gorai in dredged condition Downstream Boundaries (WL, Sal) + Sea Level Rise Trans-boundary flow (best case scenario: maximum flow since GWT) Population growth: water extraction from the river system Land-use change Ganges Basin Climate change: A1B condition (Precipitation, Temperature and Sea level rise) Scenario 1: 2030
Scenarios Trans-boundary flow (worst case scenario: minimum flow since GWT) Population growth: water extraction from the river system Land-use change Ganges Basin Climate change: A1B condition (Precipitation, Temperature and Sea level rise) Scenario 2: 2030
Scenario Trans-boundary flow (best case scenario: maximum flow since GWT Population growth: water extraction from the river system Change in water management practices Land-use change Water infrastructure development (khal system/structure improvement, Ganges Barrage) Change in water governance and institutions (including policy change) Ganges Basin Climate change: A1B condition (Precipitation, Temperature and Sea level rise) Scenario 3: 2030
Scenario Trans-boundary flow (best case scenario: maximum flow since GWT • Mimimum TBF • Maximum TBF Land-use change Ganges Basin Climate change: A1B and A2 condition (Precipitation, Temperature and Sea level rise) Scenario 4: 2030 and 2050
Simulation of Scenarios and Effect of External Drivers Farhana Akhter Kamal
Salinity Modelling Methodology South-West Regional Salinity Model
Boundary Generation Measured Q Sal 0 ppt Sal Sal Sal Sal 2 Dimensional Model (Bay of Bengal Model) Measured salinity at upstream boundaries Sea Salinity = 30 to 35 ppt Measured Q Sal 0 ppt Measured Q Sal 0 ppt 1 Dimensional Model South-West Regional Model salinity is zero at upstream Downstream salinity is taken from calibrated BoB model WL, Salinity in 12 downstream boundaries Salinity = 32 ppt Salinity boundary
Salinity intrusion and water availability in Base Condition December 2011
Salinity intrusion and water availability in Base Condition January 2012
Salinity intrusion and water availability in Base Condition February 2012
Salinity intrusion and water availability in Base Condition March 2012
Salinity intrusion and water availability in Base Condition April 2012 `
Salinity intrusion and water availability in Base Condition May 2012
Salinity intrusion and water availability in Base Condition June 2012
Sea Level Rise in Southwest Region Relative Mean Sea Level (RMSL) = Global SLR + Local Effect Projection of SLR from 1990-2100,based on IPCC temperature projections for three different emission scenarios(Rahmstrof,2009) Rahmstorf (2009) prediction for Global SLR is 124cm, A1B in 2100 over 1990 water level Local effect (from past studies and WL trend analysis) is about 5mm/yr Considering Global and local effects the SLR is 22cm in 2030 and 52cm in 2050 above 2011-2012 WL Temperature ranges and associated sea-level ranges by the year 2100 for IPCC emission scenarios
Trans-boundary flow Hardinge bridge in dry season • Daily minimum flow in the Ganges at Hardinge Bridge: • Average was 1920m3/s in Pre-Farakka period • Decreased to less than 500m3/s during Post-Farakka • The mean Increased to 730m3/s after the Ganges Water Treaty
Trans-boundary flow Monthly maximum and minimum flow since 1998
Upstream Boundaries (Q, Sal = 0pt) Minimum and maximum flow in Gorai in dredged condition Incorporating Drivers (Transboundary flow + Climate change (change in temperature and precipitation) + Sea Level Rise Meghna Padma Gorai Rainfall + R Evaporation (based on temperature change) Downstream Boundaries (WL, Sal) + Sea Level Rise
Effect of External Drivers on Drainage Conditions (MdNasim Al Azad Khan)
Kazibacha river Digital Elevation Model Area-Elevation curve Average water level 1.3 m Lower-Shalta river Average water level 1.0 m
Internal Road Network of Polder-30 • Existing drainage system of Polder-30 • 78 Khals • 15 Drainage Regulator (5 nos. 2-vent, 10 nos. 1-vent)
Delineation of catchments for internal khal network using Digital Elevation model, Road networks and Khals Total 54 no. of Catchments
Water level hydrograph at Khals Rainfall Water depth hydrograph at flood plain
Average Flood Event 1 day inundation depth
Average Flood Event 3 day inundation depth
Average Flood Event 7 day inundation depth
25 Year Flood Event 1 day inundation depth
25 Year Flood Event 3 day inundation depth
25 Year Flood Event 7 day inundation depth
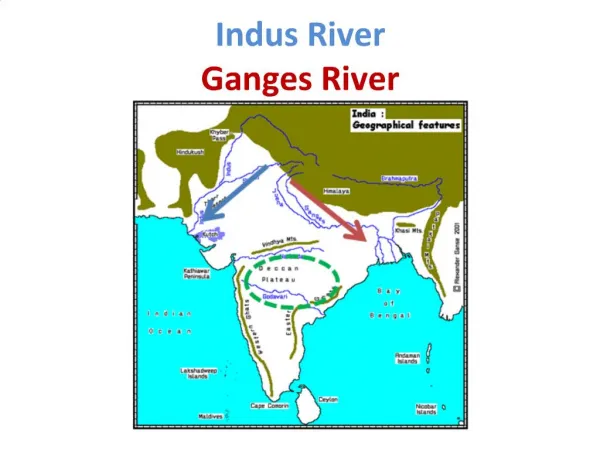
Ganges, Brammaputra and Meghna Basin Brahmaputra Basin 552,000 sq.km C H I N A N E P A L I N D I A BHUTAN Ganges Basin 1,087,000 sq.km I N D I A MYANMAR BANGLADESH Meghna Basin 82,000 sq.km B A Y O F B E N G A L Bangladesh rivers receive runoff from a catchment of 1.72 million sq. km, around 12 times its land area
Upstream Boundaries: Flows in climate change scenario Meghna Padma Gorai Rainfall + Evaporation (based on temperature change) • Precipitation at Polder • Rainfall + R • Evaporation (based on temperature change) Downstream Boundaries: Sea Level Rise
25 Year Flood Event (Scenario_2030) 1 day inundation depth
25 Year Flood Event (Scenario_2030) 3 day inundation depth
25 Year Flood Event (Scenario_2030) 7 day inundation depth
Improvement Plan-1 Re-excavation of Jhapjhapia river and khals of most water logged areas in the western part of the Polder