Download
1 / 62
630 likes | 827 Views
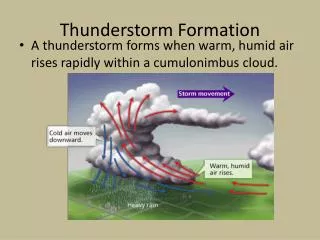
Pulse Thunderstorm Operating Strategies. Mike Cammarata NOAA/NWS Columbia, SC. Overview. Introduction What we look at What we look for An example. Climatology. Thunderstorm days at CAE (per LCD) May 6.1 June 9.3 July 12.3 August 9.4

E N D
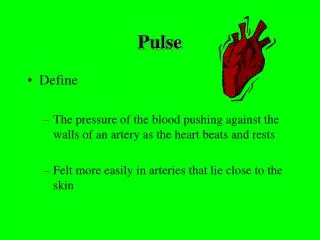
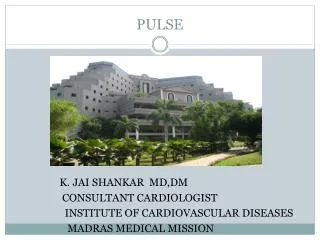
Pulse Thunderstorm Operating Strategies Mike Cammarata NOAA/NWS Columbia, SC
Overview • Introduction • What we look at • What we look for • An example
Climatology • Thunderstorm days at CAE (per LCD) • May 6.1 • June 9.3 • July 12.3 • August 9.4 • That’s at a point…we have radar ops for predominately pulse storms on the order of twice those numbers • Prime time … noon through 8 pm
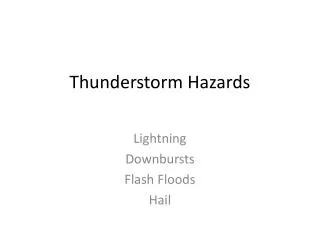
Pulse Storm Severe Weather Threat • Microbursts • Less than 4 km in outflow diameter • Peak winds last 2-5 min at most • Potential for F0 – F1 wind damage • Wind shear may reduce aircraft performance • Large Hail • Usually 0.75 to 1.00 in
Convective Potential Analysis • Analysis of stability and shear paramteters • During the convective season we do this every day at least twice per day • Important to anticipate convective mode and type of threat • Factors into warning decision e.g., if downburst threat is high, more likely to issue warning for marginal criteria
Mesoscale Desk • Ongoing meso analysis helps us to anticipate convective initiation and monitor Near Storm Environment for ongoing event • Satellite and lightning data very important • Look for trends • Satellite sounder data • ACARS data
Mesoscale Deskhttp://www.orbit.nesdis.noaa.gov/smcd/opdb/aviation/mb.html
Mesoscale Desk • http://www.orbit.nesdis.noaa.gov/smcd/opdb/aviation/mb.html • LI • TPW • CAPE • CIN • WINDEX • Theta-e deficit SFC – 300 mb • Wet Microburst Severity Index (WMSI) • GOES Soundings
Mesoscale Deskhttp://www.orbit.nesdis.noaa.gov/smcd/opdb/aviation/mb.html
Mesoscale Desk • The Local Analysis and Prediction System (LAPS) integrates data from virtually every meteorological observation system into a very high-resolution gridded framework centered on a forecast office's domain of responsibility. Thus, the data from local mesonetworks of surface observing systems, Doppler radars, satellites, wind and temperature (RASS) profilers (404 and boundary-layer 915 MHz), radiometric profilers, as well as aircraft are incorporated every hour into a three-dimensional grid covering a 1040km by 1240km area.
Mesoscale Desk • LAPS Sounding for CAE
Mesoscale Desk • LAPS CAPE • LAPS SFC Wind • Radar mosaic • LAPS analyses are available for a variety of surface and upper air fields
Mesoscale DeskSPC Web site – Composite Maps and Hourly Mesoscale Analyseshttp://www.spc.noaa.gov/exper/mesoanalysis/s1/index2.html
Staffing • Minimum requirements • Radar operator/Warning Met • Meso (TAF’s, NOW, SPS, ongoing convective and meso analysis) • Synoptic (grids, updates to public products) • HMT (2) (NWR, NOW, SPS, LSR, Hydro) • Coordinator • Ham Radio Net Controller(s) • Additional staff if widespread convection • Sectorize if you can • Polygon beta test site • Verification … real time and subsequentday
What we look at • CR/VIL Combo • Lower values filtered (<30 dBz, <30 g/kg) • Highlights stronger cells, cuts down on clutter • Looping reveals trends • Filtering can highlight outflows • Overlay • Lightning (look for trends) • MSAS wind barbs (convergence) • LAPS/MSAS LI or Cape (instability)
What we look at • CR • Laps wind barbs • Lightning
What we look at • Good example of color scheme highlighting outflow boundaries
What we look at • LRM2 (24-34kft), LRM3 (>34kft), ULR, VIL, ET • Lower values filtered • Look for values surpassing thresholds • ULR can be set based on expected height of storm or temp level e.g., -20C
What we look at • 4 Panel • VIL • CR • LRM2 • LRM3 • 63 dBZ > 24k ft • 56 dBZ > 33k ft
What we look at • All tilts Z/V 8 bit – monitor data as it arrives • Elevated high reflectivity cores • MARC signatures • Storm top divergence • Strong low level winds • 4-panel Displays can be used as well
What we look at • 4 Panel display shows high reflectivity cores and TBSS
What we look at • RCS (used heavily) • High reflectivity cores • Tilt • VCS (used by some) • Storm Top Divergence • Mid-level convergence • Near ground divergence – outflow
What we look at • CR/VIL, LRM’s, ET’s from adjacent offices • Different perspective • Corroboration • Cone of silence
What we look at • Base Velocity 0.5 8 bit • Look for strong low level radial velocities • use a “compressed” 8 bit color curve to better highlight velocities near threshold values. • Only good within 30 nm of radar • By the time a downburst signature shows up in the data it may be too late for lead time
What we look at • Base Velocity image showing thunderstorm downburst signature
What we look at • Scan • Trend Set – VIL, dBZ, dBZ ht, top, posh • Good for prioritizing and assessing trends with individual cells • Filter based on VIL or dbz
What we look at • Satellite and observed data • IR and VIS • Surface obs including mesonet data • MSAS and LAPS • LI CAPE • Pressure change • Wind barbs
What we look at • ASOS sites (yellow) • Mesonet sites (blue)
What we look for • VIL decreases by at least 10 kg/m2 and • Height of max reflectivity decreases by at least 8 kft. (Storm collapse) • POD .88 and FAR .25 • Reference … An Overview of Operational Forecasting for Wet Microbursts. William P. Roeder 45th Weather Squadron, USAF • http://www.wdtb.noaa.gov/workshop/psdp/ • WDTB Pulse Storm Downburst Prediction Workshop • Use VIL … SCAN • May be too late for lead time by the time the storm collapses
What we look forSee 02 Aug 2002 WES Sim guide • Relatively higher height of first echo appearance (20-30 kft) for severe storms vs. non-severe (10-20 kft) • Usually maintain 50-55 dBZ closed reflectivity contour as core descends • Centroid of high reflectivity core above 25 kft and top of core above 30 kft • Old rule 55 dBZ above 30 kft • Use RCS and/or All tilts Z/V 8 bit
What we look for See 02 Aug 2003 WES Sim guide • MARC signature • 50 kt convergence in 5-11 kft AGL layer • Convergence in or near high reflectivity core • Works up to 90 miles from radar (Falk et al. 1998) • Use All tilts Z/V 8 bit, VCS
What we look forMARC signaturehttp://www.srh.noaa.gov/shv/Downburst_Climo.htm
What we look forReference Mackey 1998http://www.wdtb.noaa.gov/workshop/psdp/index.htm
What we look forReference Mackey 1998http://www.wdtb.noaa.gov/workshop/psdp/index.htm
What we look for • 4 Panel display showing monster TBSS and high reflectivity core • This storm produced baseball size hail
What we look forCAE VIL of the Day • Computed as part of Convective potential analysis • Logistic Regression equation …predictand is the probability of large hail • Predictors include VIL, VIL density, 500mb T, and Totals Totals index
What we look for • VIL Density = VIL (g/kg) / ET (kft) • Values > 3.5 had a .9 POD at TUL • Amburn, S. A. and P. L. Wolf, 1997: VIL density as a hail indicator. Wea. and Forecasting, 12, 473-478. • Greg Tipton, John DiStefano WFO Wilmington, Ohio • Use 4 panel VIL ET LRM2 LRM3
What we look forFrom OTB now WDTB • Storm Top Divergence |Vout| + |Vin| • > .75 in 80 – 110 kt • 1.75 in 110 – 135 kt • 2.50 in 135 – 175 kt • 2.75 in 175 – 225 kt • 4.00+ in > 225 kt • Use All tilts Z/V 8 bit, VCS
What we look for • Height of 65 dBZ • 96% severe if above freezing level • Gerard, A., 1998: Operational observations of Extreme Reflectivity values in Convective Cells. Natl. Wea. Digest, 22, 3-8. • Greg Tipton, John DiStefano WFO Wilmington, Ohio • Very soon after getting 88D in 1994 we noticed this to be highly reliable indicator • Good for severe hail and/or wind • Use RCS and/or All tilts Z/V 8 bit
Verification • Sources • County EM Directors • County EM Dispatch • Local Sheriff, Police, Fire depts. • Spotters • HAM net • Post Offices • Local and regional Utilities • State and local parks and marinas • Media • Churches • Phone book and Street Atlas