Download
1 / 16
180 likes | 362 Views
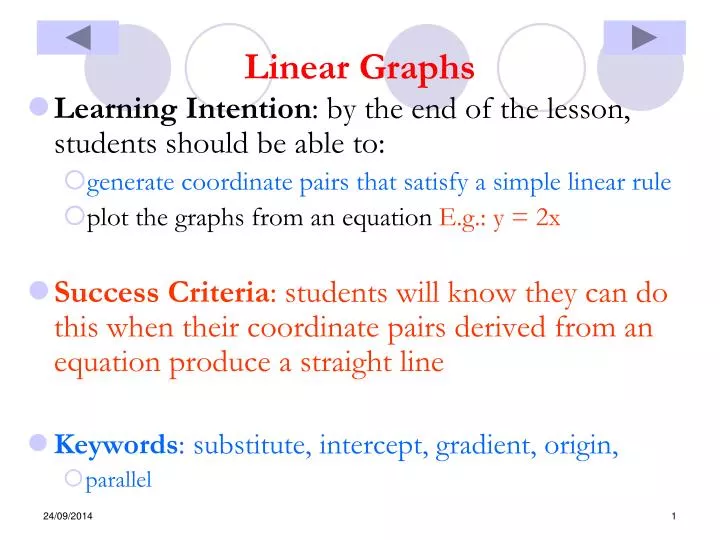
Linear Graphs. Learning Intention : by the end of the lesson, students should be able to: generate coordinate pairs that satisfy a simple linear rule plot the graphs from an equation E.g.: y = 2x

E N D
Linear Graphs • Learning Intention: by the end of the lesson, students should be able to: • generate coordinate pairs that satisfy a simple linear rule • plot the graphs from an equation E.g.: y = 2x • Success Criteria: students will know they can do this when their coordinate pairs derived from an equation produce a straight line • Keywords: substitute, intercept, gradient, origin, • parallel
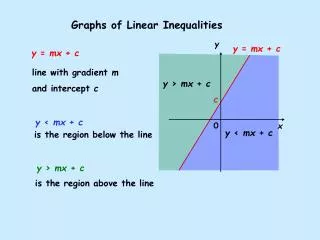
Linear Graphs straight • Linear graphs are ______ lines • The rule connecting x and y coordinates is of the form y = mx + c • ‘m’ is the gradient : how flat or how steep the graph should be • ‘c’ is the intercept: where the graph crosses the y-axis • The meeting points of the x - axis and y – axis is called the origin Presented By J. Mills-Dadson
Linear Graphs Let’s plot the coordinates of the first two rules on one grid. 1) Let us start with simple rule, y = x Join the points to draw the graph 1 2 3 0 y = x + 2 What can you say about the slope and where the cross the y – axis? y = x 2) Now let’s y = x + 2 3 4 5 2 Now let’s y = 2x + 2 4 6 8 2 Presented By J. Mills-Dadson
Linear Graphs 2) Now let’s y = x + 2 Let’s plot the coordinates of the These two rules on one grid. 3 4 5 2 y = x + 2 Now let’s y = 2x + 2 y = x + 2 4 6 8 2 Join the points to draw the graph What can you say about the slope and where the cross the y – axis? Presented By J. Mills-Dadson
Plenary 1,000,000 900,000 800,000 700,000 600,000 500,000 400,000 300,000 200,000 100,000 What is the mathematical keyword used to describe the slope (flatness and steepness) of a linear graph? A origin B intercept C gradient C gradient D x-axis Presented By J. Mills-Dadson
Plenary 1,000,000 900,000 800,000 700,000 600,000 500,000 400,000 300,000 200,000 100,000 100,000 Linear graphs are : A straight lines A straight lines B circles C curves D none of the above Presented By J. Mills-Dadson
Plenary 1,000,000 900,000 800,000 700,000 600,000 500,000 400,000 300,000 200,000 200,000 100,000 Look at y = 3x + 1. What is the value of the gradient? A 1 B 4 C 2 D 3 D 3 Presented By J. Mills-Dadson
Plenary 1,000,000 900,000 800,000 700,000 600,000 500,000 400,000 300,000 300,000 200,000 100,000 What is the mathematical keyword used to describe where a linear graph crosses the y-axis? A parallel B intercept B intercept C gradient D x-axis Presented By J. Mills-Dadson
Plenary 1,000,000 900,000 800,000 700,000 600,000 500,000 400,000 400,000 300,000 200,000 100,000 Which pair of linear graphs have the same gradient (slope)? A y = 2x + 1 & y = 3x + 1 B y = 3x + 2 & y = 3x +3 B y = 3x +2 & y = 3x +3 C y = x - 2 & y = 2x + 5 D all of the above Presented By J. Mills-Dadson
Plenary 1,000,000 900,000 800,000 700,000 600,000 500,000 500,000 400,000 300,000 200,000 100,000 Look at y =x + 1. When x is 3, what would y be? A 4 A 4 B 1 C 3 2 Presented By J. Mills-Dadson
Plenary 1,000,000 900,000 800,000 700,000 600,000 600,000 500,000 400,000 300,000 200,000 100,000 What is the name of the point where the x-axis and the y axis meet? A origin A origin B intercept C slope D parallel Presented By J. Mills-Dadson
Plenary 1,000,000 900,000 800,000 700,000 700,000 600,000 500,000 400,000 300,000 200,000 100,000 When linear graphs cross the y - axis at different points, we say the graphs have the different……… B intercepts A origins B intercepts C gradients D lengths Presented By J. Mills-Dadson
Plenary 1,000,000 900,000 800,000 800,000 700,000 600,000 500,000 400,000 300,000 200,000 100,000 Look at y = 2x + 2. If x is 7, what would y be? A 2 B 7 C 14 C 16 D 16 Presented By J. Mills-Dadson
Plenary 1,000,000 900,000 900,000 800,000 700,000 600,000 500,000 400,000 300,000 200,000 100,000 When a linear graph slopes downwards from left to right, it means the gradient is………. A 0 B positive C negative C negative D none of the above Presented By J. Mills-Dadson
Plenary 1,000,000 1,000,000 900,000 800,000 700,000 600,000 500,000 400,000 300,000 200,000 100,000 Look at y = -2x – 2. If x is 10, what would y be? A -10 B -2 C -18 C -22 D -22 Presented By J. Mills-Dadson
Today’s Class Work • Exercise 3A – Plotting Straight Line Graphs • Q1 adgj • Q2aei • Q3 all • Q4 • Q5 • Book check: • 2A Linear equations • 2B Worded problems • 2C Substitution and transposing • Redemption work: • 4B Correlation coefficient • 4C Two mean method