Download

1 / 8
130 likes | 369 Views
REPRESENTING LINEAR INEQUALITIES ON GRAPHS. You can represent an inequality on a graph. There are some important rules to follow. If the inequality is ≥ or ≤ the boundary line for the region is shown by a solid line.

E N D
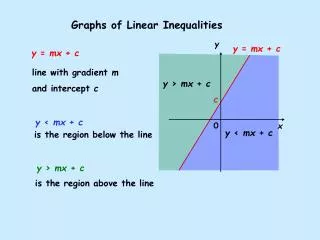
You can represent an inequality on a graph. There are some important rules to follow. • If the inequality is ≥ or ≤ the boundary line for the region is shown by a solid line. • If the inequality is > or < the boundary line for the region is shown as a broken (dashed) line. • You are expected to shade the unwanted region. (This will leave the required region clear.)
Examples y 1 Show the region x ≥ 2 on a graph. Leave the required region unshaded. 4 First draw the boundary line x = 2. 2 required region The line will be solid because of the ≥ symbol. x -2 -4 2 4 -2 Remember to shade the unwanted region. -4
Examples y 2 Show the region y < 3 on a graph. Leave the required region unshaded. 4 First draw the boundary line y = 3. 2 The line will be dashed because of the < symbol. x required region -2 -4 2 4 -2 Remember to shade the unwanted region. -4
Examples y 3 Show the region -3 ≤ x < 2 on a graph. Leave the required region unshaded. 4 First draw the boundary lines x = -3 and x = 2. 2 The line x = -3 will be solid because of the ≤ symbol. x required region -2 -4 2 4 The line x = 2 will be dashed because of the < symbol. -2 -4 Remember to shade the unwanted regions.
Examples y 4 Show the region x + y < 2 on a graph. Leave the required region unshaded. 4 First draw the boundary line x + y = 2. 2 x -2 -4 2 4 -2 The line will be dashed because of the < symbol. required region -4 Remember to shade the unwanted region.
Examples y 5 Show the region y ≥ 2x +1 on a graph. Leave the required region unshaded. 4 First draw the boundary line y = 2x + 1. 2 required region x -2 -4 2 4 -2 The line will be solid because of the ≥ symbol. -4 Remember to shade the unwanted region.
Examples y 6 A region R, contains points whose coordinates satisfy the following inequalities. x ≥ -4 y > -1 x + 2y ≤ 2 On a graph draw suitable lines and label the region R. 4 2 First show the region x ≥ -4 on the graph (remember to shade the unwanted region). x -2 -4 2 4 Next show y > -1 (remember to shade the unwanted region). R -2 Then show x + 2y ≤ 2 (remember to shade the unwanted region). -4