Download
1 / 4
40 likes | 131 Views
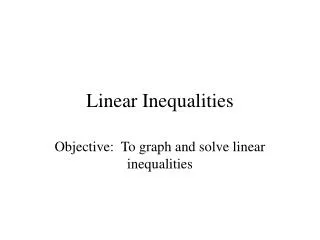
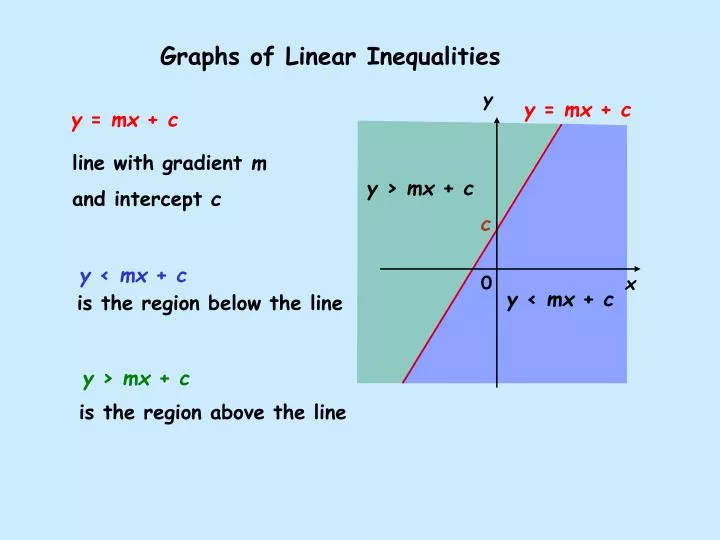
y. y = mx + c. line with gradient m and intercept c. y > mx + c. c. 0. x. y < mx + c. is the region below the line. is the region above the line. Graphs of Linear Inequalities. y = mx + c. y < mx + c. y > mx + c. y = 2 x. x. y. y. 5. 0 1 2. 4. 3. 2.

E N D
y y = mx + c line withgradient m and intercept c y > mx + c c 0 x y < mx + c is the region below the line is the region above the line Graphs of Linear Inequalities y = mx + c y < mx + c y > mx + c
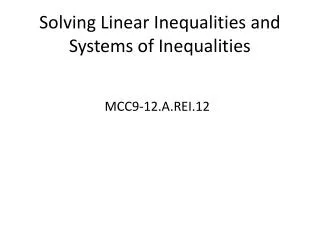
y = 2x x y y 5 0 1 2 4 3 2 (1,1) 1 x –5 –4 –3 –2 –1 0 1 2 3 4 5 y£ 2x –1 –2 –3 –4 –5 Label the required region clearly. y£ 2x Example Draw the boundary line y = 2x 0 2 4 Decide which side isy < 2x Use a point to check. Shade out the region not required.
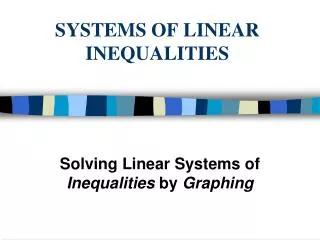
x y y 5 x + y >2 4 1 3 1 2 (0,0) 1 x –5 –4 –3 –2 –1 0 1 2 3 4 5 –1 –2 –3 –4 Label the required region clearly. –5 Example x + y >2 Draw the boundary line x + y = 2 0 2 2 0 Decide which side isx + y >2 Use a point to check. Shade out the region not required.
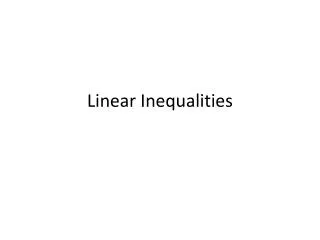
x y y 5 4 3 2x - y £5 3 1 2 (0,0) 1 x –5 –4 –3 –2 –1 0 1 2 3 4 5 –1 –2 –3 –4 2x - y = 5 –5 Label the required region clearly. Example 2x - y £5 Draw the boundary line 2x–y = 5 2.5 0 0 -5 Decide which side is2x - y£5 Use a point to check. Shade out the region not required.